
Choosing The Right Data Visualization Types To Present Data. Best Power BI Dashboard Tips and Tricks for 2021 and Beyond. Welcome to our roundup of the best and most effective Power BI Dashboard tips and tricks.
With Microsoft Power BI evolving each month, it is important to stay on top of it so you can use every feature to its fullest. In this tutorial, our CEO, Andrej Lapajne, unveils his best tips and methods for designing your dashboards, which will serve you well into 2021 and allow you to stay ahead of your competition. Note: This tutorial is based on our 1-hour webinar on the same topic. Power BI Dashboard Design: Avoid These 7 Common Mistakes. This tutorial will explore Power BI dashboard design and the most common mistakes people make when creating their dashboards.
We'll mix things up with a quick redesign to show how these lessons can be applied in practice. After you read this, you will never make these dashboard mistakes again. Datavisualisation : un supplément Archimag pour enfin donner vie à vos données ! Best practices - Power BI Visualization - SQLBI. What is a dashboard?
It is, or it should be, a visual display of the most important information needed to achieve one or more objectives, consolidated and arranged in a single screen. Does this definition corresponds to a Power BI dashboard? Not necessarily, also a report can be a dashboard in this definition. Regardless of its technical implementation, many dashboards fail to reach their goals and are merely decorative, even if they end up being ugly. And this latter issue, alone, is a good reason why a dashboard could be ignored. Dashboard Design Process. The Dashboard Wireframe Kit Our Dashboard Wireframe Kit is designed to be used as part of the Wireframe Process.
It comes with a board and decks of 54 cards for charts and graphs, with additional cards for filters and KPIs. The board is clearly labeled with best practices to help you wireframe a dashboard that answers the key questions you have about your business. Charts Charts (and graphs and tables) are the graphic representations of data on your dashboard. Considerations and Best Practices. Listen to the audio version of this article Dashboards are a unique and powerful way to present data-based intelligence using data visualization techniques that display relevant, actionable data as well as track stats and key performance indicators (KPIs).

Dashboards should present this data in a quick, easy-to-scan format with the most relevant information understandable at a glance. The term was born from the traditional automobile dashboard, and they have evolved to serve the same function in the digital world. In his book, Stephen Few put it best: A dashboard is a visual display of the most important information needed to achieve one or more objectives; consolidated and arranged on a single screen so the information can be monitored at a glance.
Creating KPIs in Power BI Desktop. Starting from the July 2020 version, Power BI Desktop offers the possibility of using external tools to modify its internal Tabular model.
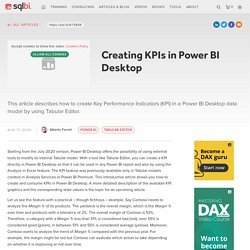
With a tool like Tabular Editor, you can create a KPI directly in Power BI Desktop so that it can be used in any Power BI report and also by using the Analyze in Excel feature. The KPI feature was previously available only in Tabular models created in Analysis Services or Power BI Premium. This introductive article shows you how to create and consume KPIs in Power BI Desktop. A more detailed description of the available KPI graphics and the corresponding state values is the topic for an upcoming article. Creating Comic Book People Using Power BI. Data Visualization Blog. Data Visualization - Reference Guides. Data visualization & storytelling best practices with Power BI (I)
By Lorenzo Vercellati, Power BI Solution Architect at Lucient “95% of presentations suck.”
The foreword of the most famous book about presentations starts with this sentence. If we think about some reports we see every day, we can probably believe that too. This article aims to identify best practices to develop a more effective, efficient, and amazing data visualization technique. Our process will develop along with four main points:
Data visualization and storytelling best practices with Power BI (II) By Lorenzo Vercellati, Power BI Solution Architect at Lucient After the theory, it is time to look at Power BI and understand the best way to apply the rules for data storytelling and visualization we spoke about in the first post of this series.
Power BI has over 37 default visuals and more than 100 custom visuals. Do not feel forced to try all: they are just choices. If you are interested in getting to know them better, here is a classification of them all. No more pie charts. Data Visualization Using Microsoft Power BI - Tutorial. The concept of Business Intelligence is something that is alien to very few people these days.
With newer tools emerging everyday to help solve the crisis of data management, most organisations have already moved in or have plans to use Business Intelligence in solving their crisis. Power BI is Microsoft’s latest BI tool mainly aimed to help everyone analyse and visualize their data. This Power BI tutorial will give you a complete insight into Power BI in the following sequence: You may go through this Microsoft Power BI recording where our Power BI Training expert has explained the topics in a detailed manner with examples that will help you to understand the concepts better. Designing With Human Centered Usability Standards. Standards and best practices are tools that UX designers rely on, to help us focus our work and ensure we design for the end-user, and not just for ourselves.
The better we understand these standards, the stronger our UX abilities: that’s why the International Organization for Standardization (ISO) has created a set of common user experience standards, called ISO 9241. These standards have been developed by industry leaders through validated research, and are intended to help designers use the best methods to generate findings we can rely on. In the first part of our article we looked at three parts of ISO 9241, including the definition of usability, its dimensions and quality aspects.
We also saw how norms on user guidance, presentation of information, and dialogue techniques can support us in creating usable interactive products. Design Thinking in a Nutshell - Visual BI Solutions. Why Design Thinking? Since the rise of User Experience Design in software development, the practice of “Design Thinking” has become widely applied in every aspect of the business. Design thinking is not a methodology used by only artists (don’t let the word ‘design’ fool you), but also by everyone who solves problems with a human-centered approach. The rise of this field can be explained by the rapid advancement as well as the saturation of new technology. As end-users of technologies, we have come to realize that fancy-looking tools cannot guarantee our satisfaction because we have barely spent enough time to study our actual needs and goals as well as our thinking and working habits.
Ebook Archimag Supplément Datavisualisation Vf. Effective dashboard design - A step-by-step guide. You don’t need to be a designer to build a dashboard that clearly communicates your key goals and metrics. Whether you’re just getting started or have a dashboard in need of a rethink, our dashboard design checklist will help you achieve the results you’re after. Be clear about what you're trying to achieve – your board’s purpose will inform its design Only include what’s important – everything should support your board’s intent Use size and position to show hierarchy – make it clear to the viewer what’s most important Give your numbers context – help your viewers know if a number’s good or bad Group your related metrics – make your metrics easy to find Be consistent – using the same visualizations and layouts makes comparing easier Use clear labels for your audience – keep them short and self explanatory Round your numbers – too much detail could make minor changes seem major Keep evolving your dashboards – check that your dashboard is encouraging the right behaviour.
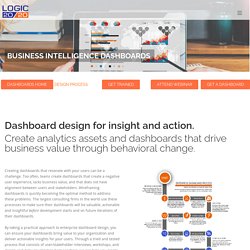
Design Thinking Process for Dashboards. Effective Dashboard Design - Principles for Best Practices. A dashboard helps managers and business leaders in tracking key KPIs or metrics and take decisions based on it. The dashboard design is important. A dashboard is usually a synopsis and often a one-pager. It can contain charts or views or tables that are backed by data. The purpose of a dashboard is to provide an efficient solution for organizing and presenting data in a clear, direct manner. It is the public-facing page where users can access and analyze their data. ISO 9241-210:2010 - Ergonomie de l'interaction homme-système — Partie 210: Conception centrée sur l'opérateur humain pour les systèmes interactifs. Prototpe - Power of a Prototype: 5 Tricks to Shape YOUR Power BI data Story. Rapports paginés dans le service Power BI - Power BI. Réalisez des rapports statistiques clairs et impactants. The Art and Science of Effective Dashboard Design.
By Jen Underwood and Jaimie Fox Dashboards can be a powerful way to communicate insights. All too often dashboard potential is not fully realized as a result of little thought being put into the final design or chosen data visualizations. By merely refining your dashboard design, you can truly enjoy the full power that lies within Power BI. The Definitive Guide to Dashboard Design. If you already use reporting software, you may wonder why you need a dashboard at all. Aren’t dashboards just another way of presenting the information that’s in reports? Simply put: no! The Data Visualisation Catalogue. The Definitive How-To for Dashboard Design. Visualisation des données.
Visualisation techniques and design elements. What are the Power BI best practices for Designing & Reporting? What are the Power BI best practices for Designing & Reporting? What are the Power BI best practices for Designing & Reporting? 10 guidelines for great Dashboard design. 10 Rules for Better Dashboard - uxplanet. 15 Best Power BI Dashboard Examples - Rigorous Themes. 35 outils pour faire parler vos données - Data Story.