
Visualizing Data. AnyChart Documentation. Overview This section is dedicated to the charts that are a part of the main AnyChart package that is shipped in anychart.min.js.
It is recommended that you read Quick Start and Working with Data articles before you read any article in this section. The best article to start with here is General Settings article to make you familiar with the basics. Almost all articles in this section are dedicated to a single chart type, series type or chart variation, all articles contain live sample you can launch, study and reuse. Supported Charts The full list of chart supported by AnyChart JavaScript Chart library is available in Supported Charts Advanced Study As all the articles here are about basic chart types, they are made to be understood by almost anyone, even those who know very little about JavaScript or charting.
AnyChart is a lightweight and robust JavaScript charting library. How to design and build a great dashboard. You don’t need to be a designer to build a dashboard that clearly communicates your key goals and metrics.
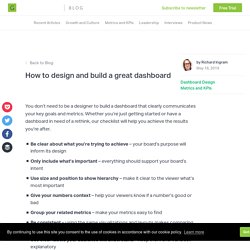
Whether you’re just getting started or have a dashboard in need of a rethink, our checklist will help you achieve the results you’re after. Be clear about what you’re trying to achieve – your board’s purpose will inform its designOnly include what’s important – everything should support your board’s intentUse size and position to show hierarchy – make it clear to the viewer what’s most importantGive your numbers context – help your viewers know if a number’s good or badGroup your related metrics – make your metrics easy to findBe consistent – using the same visualizations and layouts makes comparing easierUse clear labels your audience will understand – keep them short and self explanatoryRound your numbers – too much detail could make minor changes seem major Keep evolving your dashboards – check that your dashboard is encouraging the right behaviour Break the rules. Ultimate Guide to Business Dashboards. Business dashboards take their name from automobile dashboards; in fact, when you think about it, business dashboards are used in much the same way as automobile dashboards.

Under the hood of your vehicle, there may be hundreds of processes that impact the performance of your vehicle. Your dashboard summarizes these events using visualizations so you have the peace of mind to concentrate on safely operating your vehicle. Data visualisation: Contributions to evidence-based decision-making. The ultimate goal of knowledge intermediaries such as SciDev.Net is to improve development outcomes by enhancing the application of robust research evidence to policy and practice.
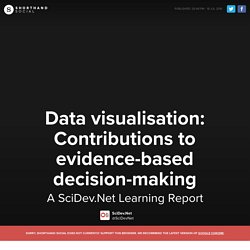
This goal is premised on the assumption that policies and practices that are informed by evidence are more effective at reducing poverty, enhancing wellbeing and stimulating sustainable economic growth. It is widely agreed that policymaking is non-linear (Shaxson 2010), meaning that the application of evidence to policy is not achieved through a single process. Indeed, an initial analysis of the impact cases submitted as part of the 2014 Research Excellence Framework Assessment[1] found that over 3,700 unique pathways from research to impact were reported (King's College London and Digital Science 2015). 2.1 Selection of research output The first step towards applying research evidence to policy and practice involves getting ‘eyeballs’ on research outputs (cf. 2.1a Wide reach 1. 2. 2.2a Facilitate interaction 1. Visualization Types - Data Visualization - LibGuides at Duke University. This taxonomy is based on a data taxonomy from: Shneiderman, B. (1996).
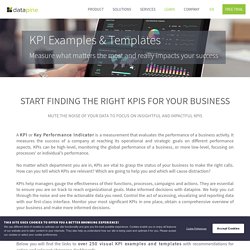
The eyes have it: A task by data type taxonomy for information visualizations. Proceedings of IEEE Symposium on Visual Languages - Boulder, CO (pp. 336-343). The taxonomy is heavily weighted toward the more abstract information visualization techniques and is less representative of scientific visualizations, which can be highly specialized by domain and are more difficult to generalize. Examples: lists of data items, organized by a single feature (e.g., alphabetical order) (not commonly visualized) The Data Visualisation Catalogue. Data Visualization Best-Practices for Main KPIs Trends. 22 Best KPI Dashboard Software & Tools (Reviewed) KPI DASHBOARD is an irreplaceable tool for any business manager. By collecting, grouping, organising, and visualising the company’s important metrics, it provides a quick overview of the company’s performance, well-being, and expected growth.
By using KPI dashboards, organisations can access their success indicators in real time and make informed decisions that help them achieve long-term goals. There’s a number of KPI dashboard software solutions on the market. From simple metric-tracking tools to advanced business intelligence solutions. Finding the right KPI dashboard suitable for your company can be a headache, so we did the hard work for you and selected 23 of the best solutions on the market. Every KPI dashboard software listed here: Is relatively easy to use with little setup timeHas unique features that stand out from other KPI dashboard softwareIs by a trustworthy provider, with regular updates and high security 1.
Top features: Pricing: From $25 user/month 2. Try Scoro for free! 3. KPI Examples - Get 250 Stunning KPI Templates For Every Use Case. Hereafter, you can find a list of KPI examples created to provide a solution for different platforms.
They are compiled into a visual representation of the most important indicators of a successful data-story. Click on the link of the specific platform to learn what it can do for you and your business! Facebook: Facebook KPIs gather content and advertising analytics to help social media professionals to optimize and maximize their social media strategy operations and results. How to Choose Best Suitable KPIs for Your Business. Pinterest. KPI Examples and Templates.