
Knowledge Media Institute. How to Track Engaged Time in Google Analytics – Google Analytics – Medium. Lately there’s been a surge of interest in time-based metrics focused on the amount of time users spend actively engaged during a session.

Because standard analytics solutions like Omniture and Google Analytics don’t provide this data out of the box, to track these metrics you generally need a specialized analytics tool, something like Chartbeat for example. But it’s actually possible to get these metrics using Google Analytics. Here’s how. First, get the Riveted plugin, which is just a small piece of JavaScript that you add to your site.
It’s available as plain JavaScript or a WordPress plugin (the following instructions assume you’re using the plain JavaScript implementation). More information about what the plugin does can be found on the Riveted project page but basically it listens for user activity signals like scrolling, clicking, using the keyboard, and page visibility to determine whether the user is an active or idle state. Options The default settings mean:
Chartbeat. Learning Locker LRS - The Learning Record Store from HT2 Labs. Tableau For Higher Education. In higher education, Tableau is unlocking the power of data to improve learning, fundraising, planning, and research.

Hundreds of leading institutions use Tableau to analyze student enrollment, achievement, and demographics. Educational institutions are developing better alumni relations and streamlining educational reporting. In the classroom and in the lab, Tableau enriches the learning experience with analytics anyone can use and understand. Students are gaining access to increasingly valuable data literacy skills and educators are sharpening lesson plans while administrators discover the best opportunities to explore.
Hoonuit. Studiokit-caliper-js. Studiokit-caliper-js is a common library of services for implementing applications with the caliper-js Javascript client for IMS Global Caliper Analytics (an implementation of the Caliper SensorAPI™). studiokit-caliper-js current supports Caliper v1.0 Features Persistent Queue: Events and Entities are saved to a queue that is persisted to localStorage, or another storage method of your choice.Convenience Methods: Easily start and end Sessions with simplified methods.Session Keep-Alive: The current Session's dateModified is periodically updated and sent to the EventStore on a timer, to track Session activity before it is ended.Session Pause: Sessions are paused automatically using window.onbeforeunload when the user leaves the site or reloads the page.
The Session is either resumed or ended upon returning to the site, based on a threshold. GitHub - IMSGlobal/caliper-js-public. Q&A w/ Rob Abel: IMS Analytics Interoperability Framework. This blog post is an interview with IMS’s Rob Abel to get to the bottom of IMS’s recent announcement of its Caliper Analytics Framework.
See related post on "small data". Feel free to post additional questions and Rob will answer them (we hope)! Q1: Is this project/announcement a big deal? A1: We’ve got a lot of very impactful stuff going on in IMS these days, but enabling widespread adoption of analytics is one of the top priorities of IMS – with a mandate coming right from the IMS Board of Directors. But, perhaps more importantly, if we want to gain the full potential benefit of analytics and dashboards in education we need to make sure it is relatively easy to enable the transmission of data from any applications that can provide useful data.
Q2: There is lots of work going on in analytics, dashboards, etc. A2: Several reasons. Q3: What is the focus of the analytics initiative versus other IMS specification work? A4: There’s a short answer and a longer answer. A6: Maybe. Q10: Will U.S. The missing link for learning from analytics. NSW LEARNING ANALYTICS WORKING GROUP (NSWLAWG) The NSW Learning Analytics Working Group brings together professionals and academics from various institutions and companies in the Sydney metropolitan area.

If you’re interested in… Learning analytics Educational data mining Learner analytics and personalisation Academic or institutional analytics Business intelligence in an institutional setting …it would be great to have you involved. We meet approximately every quarter. The next meeting will be on Wednesday 15 June 2016 at Wollongong, details below. Keep in touch Join the listserv. Next meeting: Wed 15 Jun 16 @ University of Wollongong The interactive program centres around the theme of 'personalised learning', and will be hosted by Jennifer Heath, David Fulcher, and colleagues.
To register (it's free!) The meeting will be held in the Early Start Centre (Building 21) Room G08. NodeXL › Social Media Research Foundation. NodeXL: Network Overview, Discovery and Exploration in Excel - Microsoft Research. NodeXL is a powerful and easy-to-use interactive network visualisation and analysis tool that leverages the widely available MS Excel application as the platform for representing generic graph data, performing advanced network analysis and visual exploration of networks.
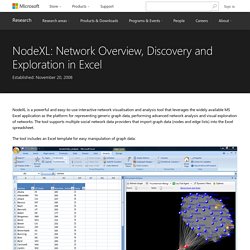
The tool supports multiple social network data providers that import graph data (nodes and edge lists) into the Excel spreadsheet. The NodeXL team is conducting interdisciplinary research in the following areas: Project contributers More information about the project can be found at. The ultimate list of Custom Dashboards and BI tools to Track your Metrics and Gather Insights. How many touchpoints do you have with your customers?
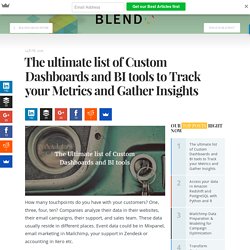
One, three, four, ten? Companies analyze their data in their websites, their email campaigns, their support, and sales team. These data usually reside in different places. Event data could be in Mixpanel, email marketing in Mailchimp, your support in Zendesk or accounting in Xero etc. But companies today are looking for insights. Yes, imagine your data from Mixpanel, Intercom, Mailchimp, Zendesk and more connected in minutes with Blendo into your own data warehouse such as Amazon Redshift, PostgreSQL or MS SQL for advanced analysis that will cover the complete customer journey and experience.
Intercom Integration - Segment. Segment makes it easy to send your data to Intercom (and lots of other integrations).
Once you've tracked your data through our open source libraries we'll translate and route your data to Intercom in the format they understand. Intercom Intercom is one place for every team in an internet business to communicate with customers, personally, at scale—on your website, inside web and mobile apps, and by email. Visit Website. Journal of Learning Analytics.