
A Simple Way to Draw Vector Graphics on the Web – Raphael JS! Introduction to Raphaël.js. Introduction SVG, short for Scalable Vector Graphics, is a XML-based language for describing objects and scenes.

SVG elements can fire events and can be scripted with JavaScript. SVG comes with several built-in primitive types such as circles and rectangles as well as being able to display text. While SVG as a technology is not new, HTML5 now enables SVG objects to be embedded in a page directly without the use of a <object> or <embed> tag bringing it in line with what is currently available with the canvas. Raphael JS Quickstart. Construire une carte d'Europe interactive avec Raphael JS. Raphaël · Live. Raphaël: a JavaScript API for SVG.
By Dmitry Baranovskiy Introduction The first time I saw SVG in 2000–2001, I was blown away by the power it has, and the simplicity of the language, but I was also dismayed that I couldn't really make use of it, because browsers didn't support it.
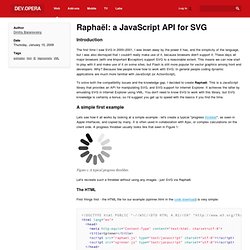
These days all major browsers (with one Important Exception) support SVG to a reasonable extent. This means we can now start to play with it and make use of it on some sites, but Flash is still more popular for vector graphics among front end developers. Why? To solve both the compatibility issues and the knowledge gap, I decided to create Raphaël. A simple first example Lets see how it all works by looking at a simple example - let's create a typical "progress throbber", as seen in Apple interfaces, and copied by many. Let's recreate such a throbber without using any images - just SVG via Raphaël. The HTML First things first - the HTML file for our example (spinner.html in the code download) is very simple: <! Coding. Des graphes avec Raphaël JS. Assez récemment j’ai découvert une superbe librairie JavaScript Open Source qui permet tout simplement de manipuler des objets vectoriels.
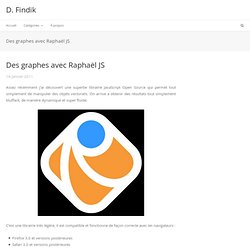
On arrive a obtenir des résultats tout simplement bluffant, de manière dynamique et super fluide. C’est une librairie très légère, il est compatible et fonctionne de façon correcte avec les navigateurs : Firefox 3.0 et versions postérieuresSafari 3.0 et versions postérieuresChrome 5.0 et versions postérieuresOpera 9.5 et versions postérieuresInternet Explorer 6.0 et versions postérieures Il est disponible sous licence MIT et donc, permet de jouer avec des objets SVG. Les objets SVG (Scalable Vector Graphics) sont un ensemble de données qui permettent de décrire des graphiques vectoriels en se basant sur le langage XML.
Comme le SVG utilise l’XML, le contenu du document XML est organisés sous forme d’arbre. Pour commencer il nous faut les données, dans mon exemple les données seront fournis via une requêtes à une table dans une base de données MySQL. Basic chart with Raphael and a few learning resources - Błażej Klisz - Web Development Blog. An Introduction to the Raphael JS Library. Raphael JS is a lightweight and super-sexy JavaScript framework that allows you to draw vector graphics in your browser!
In this tutorial, I will introduce you to some basic drawing functionality, take a look at animation, provide DOM access and finally finish off by creating a cool widget for your site... Framework: Raphael JSVersion: 1.0Difficulty: Beginner to IntermediateEstimated Completion Time: 30 minutes Let's get started by downloading the Raphael JS framework from here. At the top right of the page, you'll see compressed and uncompressed copies of Raphael version 1.0. I'd recommend you grab yourself a copy of the uncompressed source for the time being - this way you can have a peek at the source and see what extra edge you can get on the documentation. Raphael.js Tutorial. Preview Download Free Preview Never mind the HTML5 canvas, here’s SVG with Raphael.js!

For 15 years, front-end web developers have missed out on one of the most basic parts of any programming environment: drawing. Tuto Introduction à Raphaël. Raphaël Reference. Créer une carte de France cliquable en HTML5 / SVG. Raphael js, Drawing a funny monster. When i was young i discovered that it’s possible to draw using Qbasic language ..
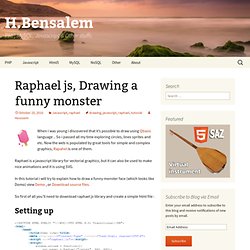
So i passed all my time exploring circles, lines sprites and etc. Now the web is populated by great tools for simple and complex graphics, Rapahel is one of them. Raphael is a javascript library for vectorial graphics, but it can also be used to make nice animations and it is using SVG. In this tutorial i will try to explain how to draw a funny monster face (which looks like Domo) view Demo , or Download source files.
So first of all you’ll need to download raphael js library and create a simple html file : Setting up The important thing is “paper” value which is the raphale object : 1 . drawing the head and the mouth : This code will give us : Raphaël—JavaScript Library. Raphael JavaScript library simplifies creating graphics. The Raphael JavaScript library delivers a simple-to-use framework for creating graphics.
Tony Patton explains how to use the Raphael library and describes the various options that are available in it. Adding flare to a Web page often requires thorough knowledge of a graphic package like Photoshop or another technology like Flash. However, a number of technologies exist to create graphics within a Web page. The Raphael JavaScript library takes advantage of these technologies to deliver a simple-to-use framework for creating graphics. Using vector graphics Mathematical equations are at the heart of vector graphics. Raphael js Demo/tutorial. Creating a chart with raphael.js from a google spreadsheet - Jérémi Joslin's blog.
We want to get data from a google spreadsheet and display it as a chart using gRaphaël . We are going to transform the following spreadsheet into a bar graph. gRaphaël’s goal is to help you create stunning charts on your website. gRaphaël is based on raphael.js . Raphael.js is a small JavaScript library that should simplify your work with vector graphics on the web. It currently supports Firefox 3.0+, Safari 3.0+, Opera 9.5+ and Internet Explorer 6.0+. You can download the code of the sample at the end of this article. 1. Google spreadsheet offers to serve its data thanks to the Google Data Protocol . 1.1 Preparing our spreadsheet Create a spreadsheet that look like our (2 columns: the first one contain the label, and the second one the data) Save and publish the spreadsheet (Warning! 1.2 Loading the spreadsheet data /* * Specify the information about our spreadsheet */ var spreadsheet_id = "tiRm6cBSE3AZJnyLC6Wlysw" , worksheet_id = "od6" ; 2.
You have now a beautiful Graph. see the result. Animated Skills Diagram with Raphaël. In this tutorial we will show you how to create a diagram using Raphaël – a small JavaScript library that is great for working with vector graphics.
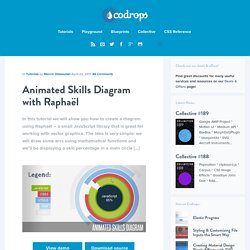
The idea is very simple: we will draw some arcs using mathematical functions and we’ll be displaying a skill percentage in a main circle […] View demo Download source In this tutorial we will show you how to create a diagram using Raphaël – a small JavaScript library that is great for working with vector graphics. The idea is very simple: we will draw some arcs using mathematical functions and we’ll be displaying a skill percentage in a main circle when we hover over those arcs. Let’s start with the markup. The Markup The HTML structure is going to consist of a main container with the class ‘get’. The CSS In the CSS we will only do two things: hide the elements with the class ‘get’ and set the width and height of the div with the id ‘diagram': The JavaScript.