
Data Visualization Network of Resources. Ruby on rails - How to implement web-based graph editing for Neo4j. How to Use Sigma.js with Neo4j. I’ve done a few posts recently using D3.js and now I want to show you how to use two other great Javascript libraries to visualize your graphs.
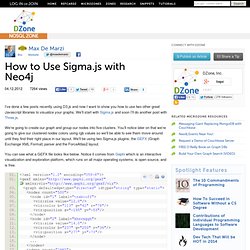
We’ll start with Sigma.js and soon I’ll do another post with Three.js. We’re going to create our graph and group our nodes into five clusters. You’ll notice later on that we’re going to give our clustered nodes colors using rgb values so we’ll be able to see them move around until they find their right place in our layout. We’ll be using two Sigma.js plugins, the GEFX (Graph Exchange XML Format) parser and the ForceAtlas2 layout.
You can see what a GEFX file looks like below. 01. <? 03. 04. 05. 06. 07. 08. Using Sigma.js with Neo4j. I’ve done a few posts recently using D3.js and now I want to show you how to use two other great Javascript libraries to visualize your graphs.
We’ll start with Sigma.js and soon I’ll do another post with Three.js. We’re going to create our graph and group our nodes into five clusters. You’ll notice later on that we’re going to give our clustered nodes colors using rgb values so we’ll be able to see them move around until they find their right place in our layout. We’ll be using two Sigma.js plugins, the GEFX (Graph Exchange XML Format) parser and the ForceAtlas2 layout. You can see what a GEFX file looks like below. In order to build this file, we will need to get the nodes and edges from the graph and create an XML file. We’ll use Cypher to get our nodes and edges: We need the node and relationship ids, so notice I’m using the ID() function in both cases.
So far we have seen graphs represented as JSON, and we’ve built these manually. Credit goes out to Alexis Jacomy and Mathieu Jacomy. Hairball/ Jun 25, 2012 Network visualization is a topic as complex as many of the hairballs it produces but Sigma.JS is designed to break through the clutter and graph networks that are more readable and user-friendly.

It’s creator, Alexis Jacomy, has really pushed the practice of network visualization forward with this tool. He has combined elements of existing examples in new ways that seem to work better together. Especially worth noting are the ‘hide node‘ and ‘fish-eye‘ examples. His hard work really pays off in the speed and responsiveness of the tool. Interestingly, Santiago Ortiz developed a network visualization of data driven resources that uses a lot of the same principles. Json - javascript sigma.js visualization - way over my head. Examples. ForceAtlas2, the new version of our home-brew Layout.
The new version of the build-in layout ForceAtlas is now released.

It is scaled for small to medium-size graphs, and is adapted to qualitative interpretation of graphs. The equations are the same as ForceAtlas 1, but there are more options and innovative optimizations that make it a very fast layout algorithm. It is good enough to deal with very small graphs (10 nodes) and fast enough to spatialize 10,000 nodes graphs in few minutes, with the same quality. If you have time, it can deal with even bigger graphs. Update Gephi (Help > Check for Updates) to get this new layout. Force Atlas 2: Is a continuous algorithm, that allows you to manipulate the graph while it is rendering (a classic force-vector, like Fruchterman Rheingold, and unlike OpenOrd)Has a linear-linear model (attraction and repulsion proportional to distance between nodes).
Force Atlas 2 features these settings: Scaling: How much repulsion you want. Related Posts: Plugins ~ algorithm force atlas layout Trackback. A lightweight JavaScript graph drawing library. Explore Reddit comments network with sigma.js.