
Understanding selectAll, data, enter, append sequence in D3.js. If you are new to D3.js and have looked at the various D3.js examples on the web to learn it, you have most probably come across a sequence of selectAll(), data(), enter() and append() statements as shown in Example 1 below.
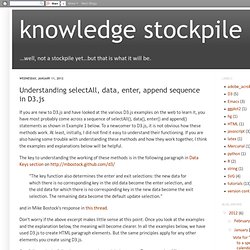
To a newcomer to D3.js, it is not obvious how these methods work. At least, initially, I did not find it easy to understand their functioning. If you are also having some trouble with understanding these methods and how they work together, I think the examples and explanations below will be helpful. The key to understanding the working of these methods is in the following paragraph in Data Keys section on "The key function also determines the enter and exit selections: the new data for which there is no corresponding key in the old data become the enter selection, and the old data for which there is no corresponding key in the new data become the exit selection.
Index of /js/d3/examples/ Dyn Lunch and Learn: D3.js. Data and DOM Manipulations Library Data Driven Documents.

YES! Fast, small (minimalisic core and extra modules) allows to template DOM element creation utilizes common idea "Find something in DOM and keep it in array" plays nicely with HTML5 and other tools (would also switch to Sizzle, if available) very well documented (mbostock.github.com/d3/api/) Basic Example. Four Ways to Slice Obama’s 2013 Budget Proposal - Interactive Feature. d3: scales, and color. D3 scales and interpolation « nelsonslog. D3 has a notion of “scales”, transformations of data from a domain to a range.
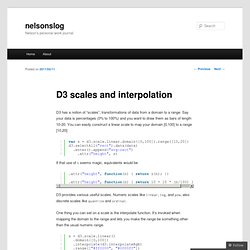
Say your data is percentages (0% to 100%) and you want to draw them as bars of length 10-20. You can easily construct a linear scale to map your domain [0,100] to a range [10,20]: If that use of s seems magic, equivalents would be D3 provides various useful scales. Numeric scales like linear, log, and pow, also discrete scales like quantize and ordinal.
Tutorial: Introduction to D3. Check out the final result here!
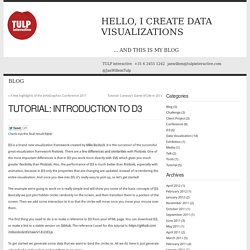
D3 is a brand new visualization framework created by Mike Bostock. It is the successor of the successful great visualization framework Protovis. Tutorial: Line chart in D3. One of the most common visualizations is a line chart.
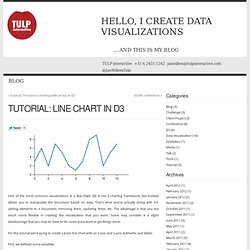
D3 is not a charting framework, but instead allows you to manipulate the document based on data. That’s what you’re actually doing with D3: adding elements to a document, removing them, updating them, etc. The advantage is that you are much more flexible in creating the visualization that you want. Some may consider it a slight disadvantage that you may do have to do some extra work to get things done.
For this tutorial we’re going to create a basic line chart with an x-axis and y-axis, tickmarks and labels. First, we defined some variables: The data variable contains our dataset we want to display as a line chart. Next we append an svg element to our document with the proper width and height, and then we append a g element to this svg element so that all the elements that will be appended to this g element will be grouped together. Tutorials · mbostock/d3 Wiki.
Wiki ▸ Tutorials Please feel free to add links to your work!!
Tutorials may not be up-to-date with the latest version 4.0 of D3; consider reading them alongside the latest release notes, the 4.0 summary, and the 4.0 changes. Introductions & Core Concepts Specific Techniques. Mike Bostock. December 27, 2014Mapping Every Path to the N.F.L.

Playoffs December 20, 2014How Each Team Can Make the N.F.L. Playoffs November 5, 2014The Most Detailed Maps You’ll See From the Midterm Elections November 3, 2014How To Scroll September 19, 2014‘Stop-and-Frisk’ Is All but Gone From New York July 26, 2014Mapping the Spread of Drought Across the U.S. June 26, 2014Visualizing Algorithms June 15, 2014Three Little Circles.
D3.js. Visualizing Data with Web Standards. Water. Using d3.js to visualize GIS. I've been playing around with d3.js a bit the last couple of days and it's a great little javascript library to visualize information.
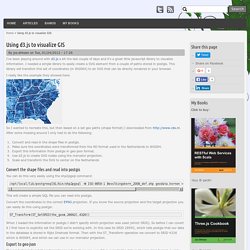
I needed a simple library to easily create a SVG element from a couple of paths stored in postgis. This library will transfom this set of coordinates (in WGS84) to an SVG that can be directly rendered in your browser. I really like the example they showed here: So I wanted to recreate this, but then based on a set geo paths (shape format) I downloaded from After some messing around I only had to do the following: Convert and read in the shape files in postgis.Make sure the coordinates were transformed from the RD format used in the Netherlands to WGS84.Export this information from postgis in geo-json format.Use d3.js to create SVG nodes using the mercator projection.Scale and transform the SVG to center on the Netherlands.
Building a tree diagram in D3.js - Pixel-in-Gene. In the past few weeks, I have spent some time evaluating some visualization frameworks in Javascript.
The most prominents ones include: Javascript InfoVis Tookit, D3 and Protovis. Each of them is feature rich and provides a varieties of configurable layouts. In particular I was impressed with D3 as it gives a nice balance of features and flexibility and allowed me to build just the visualizations I wanted. In this post, I want to take a quick dive into using D3 for building a tree diagram. A brief course on D3 One of the most striking features of the D3 framework is the use of selections, which allows you to add, update and remove elements in one single chained call. Every render element has an __data__ property that contains the bound data. This selects all SVG Path elements with a class name of “link” from the parent element: layoutRoot. D3 Tutorials. <div id="js_warning"><strong>JavaScript is turned off, so this page won’t be very interactive.
</strong> Switch JavaScript back on in your web browser for the full experience. </div> Thinking with Joins. Say you’re making a basic scatterplot using D3, and you need to create some SVG circle elements to visualize your data. You may be surprised to discover that D3 has no primitive for creating multiple DOM elements. Wait, WAT? Sure, there’s the append method, which you can use to create a single element. Documentation. Learn the basics of D3 with this introductory tutorial, covering the core concepts of selections and data binding. Read me first! Using the example of a no-frills, static bar chart, this guide describes the core D3 concepts, including selections, functional properties, and scales.
You'll also see how D3 can be applied to HTML, CSS and SVG. A continuation of the above introductory tutorial, this guide covers more exciting dynamic aspects of D3, including transitions and data joins. d3.js experiments in the console. d3 (aka Data-Driven Documents) is a great little JavaScript framework for data visualization. It’s got a nice declarative syntax for DOM manipulation that’s quite readable, but takes a bit of effort to understand exactly what it’s doing. Favorite links: UPDATE: Dashing D3.js is an amazing series of tutorials with great conceptual groundingd3 tutorials provide a great conceptual foundationThinking with Joins by d3 creator, Mike Bostick, helps explain the syntax for chaining methodsScott Murray’s d3 tutorial offers a very nice step-by-step, covering a lot of the same ground as my little tutorial below with excellent discussions of the fundamentals. Word Cloud Generator.
Combining D3 and Raphael to make a network graph « dataist. During the past week I have been working on a visualization for Sveriges Radio about Melodifestivalen, the Swedish qualification for the Eurovision Song Contest. Every year there is a HUGE fuzz about this show over here in Sweden. I wanted to explore the songwriters in the competition from a dataist perspective. Who are the guys behind the scene?
JUNG in Neo4j – Part 2. d3.js. Screencast / vidéo d3.js + sinatra + elasticsearch + capucine. d3.js. D3.js is Not a Graphing Library, Let's Design a Line Graph. D3 for Mere Mortals. By Luke Francl (look@recursion.org), August 2011. First steps in data visualisation using d3.js, by Mike Dewar. This happens to be one of those rare instances where the benefit of hindsight does not make me regret something said flippantly on a panel.
I deeply believe that in order to truly change the world we cannot simply "throw analytics at the problem. " To that end, the medical and health industries are perhaps the most primed to be disrupted by data and analytics. To be successful, however, a deep respect for both the methodological and clinical contexts of the data are required. It is incredibly exciting to be at an organization that is both working within the current framework of health care and data to create new insight for people, but also pushing the envelope with respect to individuals' relationships with their own health. The challenges are technical, sociological, and political; but the potential for innovation that exists in this space comes along very rarely.
Bost.ocks.org/mike/d3/workshop/