
Teacher & Student Planners. Teachers Printables. Graphic Organizers. Graphic Organizers for Content Instruction. One of our roles as ESL and bilingual specialists is to encourage mainstream teachers to employ teaching techniques which make content area information more accessible to second language learners.
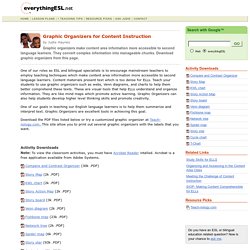
Content materials present text which is too dense for ELLs. Teach your students to use graphic organizers such as webs, Venn diagrams, and charts to help them better comprehend these texts. These are visual tools that help ELLs understand and organize information. They are like mind maps which promote active learning. Graphic Organizers can also help students develop higher level thinking skills and promote creativity. One of our goals in teaching our English language learners is to help them summarize and interpret text. Download the PDF files listed below or try a customized graphic organizer at Teach-nology.com. Reading_Strategies_Reproducibles_Buehl.
Interactive Graphic Organizer - Teaching Notes. Interactive Graphic Organizer. Holt Interactive Graphic Organizers "Graphic organizers are tools that help your brain think.
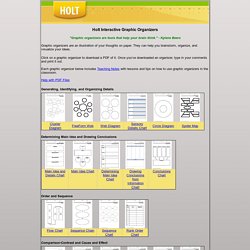
" - Kylene Beers Graphic organizers are an illustration of your thoughts on paper. They can help you brainstorm, organize, and visualize your ideas. Click on a graphic organizer to download a PDF of it. Once you’ve downloaded an organizer, type in your comments and print it out. Each graphic organizer below includes Teaching Notes with lessons and tips on how to use graphic organizers in the classroom. Help with PDF Files Generating, Identifying, and Organizing Details Determining Main Idea and Drawing Conclusions Order and Sequence Comparison-Contrast and Cause and Effect Process and Cycle Diagrams Evaluating and Making Decisions Persuasive and Supporting a Position Vocabulary Miscellaneous Organizers. Graphic Organizers. Prepared by Tracey Hall & Nicole Strangman Please visit the AIM Center home page.

Introduction One way to help make a curriculum more supportive of students and teachers is to incorporate graphic organizers. Graphic organizers come in many varieties and have been widely researched for their effectiveness in improving learning outcomes for various students. The following five sections present a definition of graphic organizers, a sampling of different types and their applications, a discussion of the research evidence for their effectiveness, useful Web resources, and a list of referenced research articles.
Top Definition A graphic organizer is a visual and graphic display that depicts the relationships between facts, terms, and or ideas within a learning task. Exploratree - Exploratree by FutureLab. Innovativocab.wikispaces. Essay Map. WorksheetWorks.com. Frayer Model. The Frayer Model is a vocabulary development tool. In contrast with a straight definition, the model helps to develop a better understanding of complex concepts by having students identify not just what something is, but what something is not. The center of the diagram shows the concept being defined, while the quadrants around the concept are used for providing the details.
Words that work well with the Frayer Model include quadrilaterals, insects and democracies. We have included two variations of the model that we have seen used in school settings. 80+ Google Forms for the Classroom. If you're new here, you may want to subscribe to my weekly newsletter.
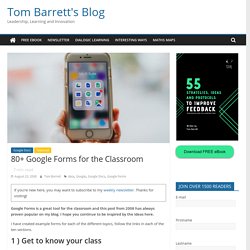
Thanks for visiting! Google Forms is a great tool for the classroom and this post from 2008 has always proven popular on my blog. I hope you continue to be inspired by the ideas here. I have created example forms for each of the different topics, follow the links in each of the ten sections. 1 ) Get to know your class Use this form to gather some indication from your new class about their likes and dislikes, their favourite lessons or after school clubs they enjoy. 2 ) Emotion graph An emotion graph is a simple line graph comparing a range of happiness to sadness against different points (time) in a story or film.
Use a Google Form to gather the children’s responses to different parts of any type of linear narrative, written or visual. 3 ) Spelling test Steve Kirkpatrick had this brainwave a while back so check out his excellent post for more information about setting up the spreadsheet. 4 ) Comprehension questions. Think Technology: Graphic Organizers. Graphic Organizers.