
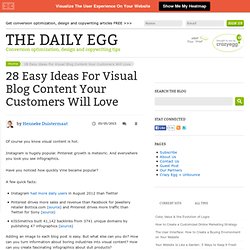
Google Databoard. Databoard: So sieht Googles neues Tool zum Basteln von Infografiken aus. Mithilfe des Google Databoard „können Nutzer die jüngste Forschungsarbeit von Google in einzigartiger Weise erkunden“, heißt es im Unternehmensblog.

Der Webdienst präsentiert die Forschungsergebnisse jüngster Untersuchungen mit bunten Grafiken und Illustrationen. Sie lassen sich über Soziale Netzwerke, per E-Mail oder Link mit dem eigenen Netzwerk teilen und in beliebiger Reihenfolge und Kombination zu Infografiken zusammenstellen. Aufgrund stark eingeschränkter Bearbeitungsfunktionen gelingt das auch Nutzern ohne Vorerfahrung in Sachen Design. Die finalen Grafiken wirken übersichtlich und aufgeräumt, allerdings auch ein bisschen eintönig.
Google Databoard: Infografiken für Anfänger Google hat sich mit dem Databoard drei Ziele gesetzt, schreibt Mobile Marketing Manager Adam Grunewald : Nutzer sollen die verfügbaren Daten einfach verstehen, einfach teilen und einfach kombinieren können. Google Databoard lässt sich unangemeldet und kostenlos nutzen. Information Is Beautiful. 60 brilliant examples of infographics.
Every picture tells a story, as they say, but sometimes it takes a clever combination of words and pictures to tell a story quickly, concisely and in an entertaining fashion. The best infographics may look like they were simple to create in Photoshop, but designing an effective piece of data visualization is usually anything but. There are several great tools to create infographics, but these examples of infographics from around the web will show you how you can take it a step further and add a bit of style and personality to your data.
Some are older than others, but they can still provide some inspiration for those of you looking to create an infographic from scratch. Some are funny, some more serious, and all are inspiring examples of the art. If Star Wars: The Last Jedi has put you in the mood to immediately watch the original movie, hold your horses just one second. 02. 03. Are you reading this slumped at your desk? 04. Do you know your aperture from your apex? 28 Ideas For Creating Image Based Content. Of course you know visual content is hot.
Instagram is hugely popular. Pinterest growth is meteoric. And everywhere you look you see infographics. Have you noticed how quickly Vine became popular? A few quick facts: Instagram had more daily users in August 2012 than TwitterPinterest drives more sales and revenue than Facebook for jewellery retailer Bottica.com (source) and Pinterest drives more traffic than Twitter for Sony (source)KISSmetrics built 41,142 backlinks from 3741 unique domains by publishing 47 infographics (source) Adding an image to each blog post is easy. It may seem hard to create enchanting visual content.
Below are 28 simple ideas to inspire your visual content creation. Help your customers with visual buying advice How can you use visuals to help your customers buy the right product for their requirements? How can you be helpful rather than sell? Below follow eleven ideas to advise and help your customers: Build authority by sharing visual information about your industry. 40 unterhaltsame Infografiken und Tipps zur eigenen Gestaltung mit Photoshop. Infografiken bilden häufig komplexe Zusammenhänge stark vereinfacht in Illustrationen ab.

Informationen werden visualisiert, wobei der Textanteil deutlich kleiner ist, als die fast schon selbst erklärenden Grafiken. So kann der Betrachter Fakten schneller erfassen. Bildquelle: Lauren Manning via photopin cc Wir haben in dieser Kollektion 40 unterhaltsame Infografiken gesammelt. Diese stammen aus unterschiedlichen Bereichen des Weltennetzes. Und wenn Sie dann selbst tätig werden wollen, haben wir was für Sie: Zwischen den Infografiken finden Sie Tipps und Tricks zur eigenen Gestaltung. Designing The “World Of Programming” Infographic Website: smashingmagazine.comThema: Geschichte der Programmiersprachen © Adit Gupta Logos: A Look at the Meaning in Colors [Infographic] Website: dailyinfographic.comThema: Wirkung von Farben © Grayson Quick Tips for Obtaining a Trademark.
5 free tools for creating infographics. Done right, infographics can be a great way to make sense of complex data.
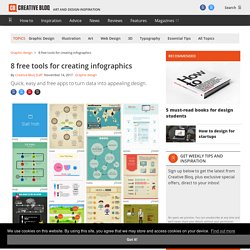
The best infographics transform complex information and data into graphics that are both easy to grasp and visually appealing. The only problem is, infographics that look like they were simple to make are often anything but. Exclusive offer: Save 15% on Adobe Creative Cloud now Here, we've selected our top free tools and apps for making infographics. Some of the options here are even suitable for non-designers, as templates and other features make them easy to use. Give these free tools a try and let us know which ones you get on best with on Facebook or Twitter. 01. Visme promises to help you 'speak visually'. School of Data - Learn how to find, process, analyze and visualize data.
Seven dirty secrets of data visualisation. Infografiken selbst erstellen: 10 Tools, die dabei helfen. Infografiken liegen im Trend.
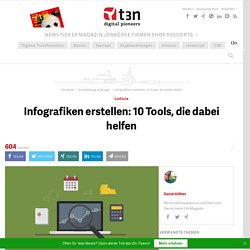
Doch die Visualisierung von Daten erfordert viel Vorbereitung und die richtigen Werkzeuge. Mit diesen Tools kannst du Infografiken einfach selbst erstellen. Infogram Der Webdienst Infogr.am richtet sich an blutige Anfänger. Dank vorgefertigter Templates stehen die Chancen gut, ein optisch ansprechendes Ergebnis zu erzielen. Piktochart Ein ähnliches Prinzip verfolgt auch Piktochart, das im Vergleich zu anderen Einsteiger-Tools viele Möglichkeiten zur Individualisierung bietet. Visme Noch recht neu am Markt ist Visme. Easelly Anders als bei Infogr.am oder Visme können Nutzer von Easelly keine CSV-Dateien importieren. Canva. S Most Wanted Winners – Infographics. Many congratulations to the following authors who took part in our Envato’s Most Wanted event where we invited authors to submit Infographics to VideoHive: pareylook - $200 for submitting 1 itemAlexTantsura - $200 for submitting 1 itemPerryCox - $200 for submitting 1 itemFORZi - $200 for submitting 1 itemgwigam - $200 for submitting 1 itemmadejune - $200 for submitting 1 itemmasterdot - $200 for submitting 1 itemzhenjueyimen - $200 for submitting 1 itemel-paranoik - $400 for submitting 2 items 1, 2sfxstudio - $200 for submitting 1 itemRwhe - $200 for submitting 1 itemreedjp2 - $200 for submitting 1 itemkeybal - $200 for submitting 1 itemTheBendaxDesing - $200 for submitting 1 itemskyboy - $200 for submitting 1 itemMocarg - $200 for submitting 1 itemGrandTerr - $400 for submitting 2 items 1, 2Or1on - $200 for submitting 1 item All authors will be receiving cash (PayPal/Skrill) payments within the next couple of weeks and will also receive an Envato’s Most Wanted badge!

Superhero Statistics.