Free mind mapping (and related types) software
I see regular inquiries on Twitter and in forums from people looking for free software to support visual thinking. To provide answers, InformationTamers have put together 14 pages to help you find the one for your needs. These show the platform, a screen thumbnail and a link for more information in each case.
Math Practice - Aplicações no Android Market
★ Math for kids is either a big task or a milestone. Teaching your child math isn't something that happens overnight. ★ Remember KISS - Keep It Simple, Stupid! Small children aren't going to be able to handle too much complexity with math at this point. Be patient and never go faster than your child can take. ★ Begin teaching them with an interactive activity.
Relation Browser / Visualisations showing relations
Relation Browser - Moritz Stefaner Different types of relations, different type of entities. Number of relations should not get bigger then ~25. Nice animations. "Flat" - every relation is equal. No sorting, or filtering.
Word Search Maker - Form
Adding Words Locked Spell Check: Enabled Word List Saving Options Save your entered words for our other puzzle makers!
Animaps - Create Animated Google Maps
Animaps is a new service that was built for the purpose of allowing users to create animated Google Maps. The basics of creating maps in Animaps is very similar the process for creating maps in Google Maps. The main benefit of using Animaps over Google Maps is that you can create a tour of your placemarks that plays through according to the timing that you specify.
Conceptua™ Math - Free Fractions Tools
Conceptua Math includes interactive, visual tools that are ideal for teacher-facilitated, whole-class instruction, "Number Talks" and for parents supporting their students at home. These tools, available free of charge, are located under the Tool Library tab in our full curriculum. The full Conceptua Math curriculum includes integrated teacher supports, adaptive teaching, student investigations, and much more. Teachers Build Instructional Expertise with Supports Teachers start with scripted Lesson Openers to introduce concepts and generate fraction Number Talks with the whole class.
50 Great Examples of Data Visualization
Wrapping your brain around data online can be challenging, especially when dealing with huge volumes of information. And trying to find related content can also be difficult, depending on what data you’re looking for. But data visualizations can make all of that much easier, allowing you to see the concepts that you’re learning about in a more interesting, and often more useful manner. Below are 50 of the best data visualizations and tools for creating your own visualizations out there, covering everything from Digg activity to network connectivity to what’s currently happening on Twitter. Music, Movies and Other Media Narratives 2.0 visualizes music.
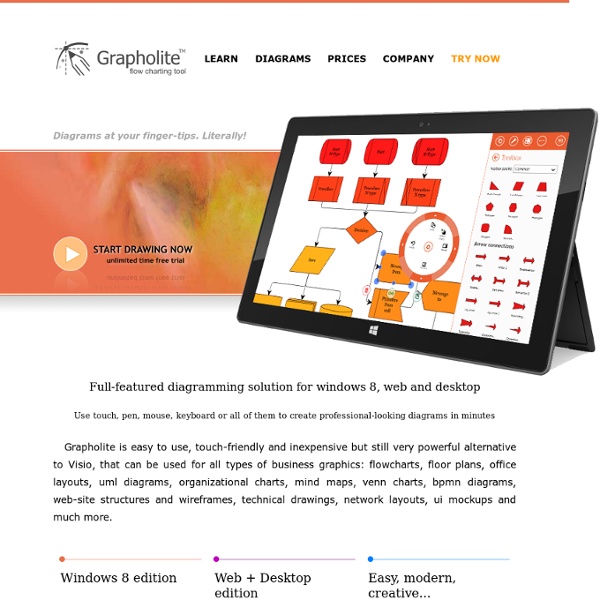
45+ Free Online Tools To Create Charts, Diagrams And Flowcharts
Charts and graphs are the best ways to represent information and relationship between two interlinked entities. Not only do charts and graphs inform visitors about the trend or relationship you want to show them but also add a visual connection with the visitors. Several online tools are available that help you create comprehensively designed flowcharts and graphs that worth a thousands words. Check them out and let us know what you feel about these tools. Barchart
Web 2.0 Tools for Math Educators
By Laura Turner This is a continuing series on Web2.0 and other web-based tools for educators. This information is specific to math educators, but there is some crossover into science. Math educators will find a large number of useable interactive companion web sites for the teaching of math concepts and skills. 3Dvinci 3D design is a great motivational and instructional tool.