
Apple's Top Leaders Use This Simple Presentation Hack to Make Their Slides Instantly Memorable. Your audience is overwhelmed with data, numbers, and statistics in their daily lives.
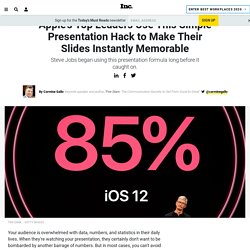
When they're watching your presentation, they certainly don't want to be bombarded by another barrage of numbers. But in most cases, you can't avoid meaningful statistics that provide the evidence for your pitch or proposal. What's a speaker to do? The folks who design Apple's slides have a solution. It's brilliant. When Apple CEO Tim Cook began talking about a new release of Apple's mobile operating system (iOS 13), he said: "iOS has the highest customer satisfaction in the industry, with an incredible 97 percent. " That's it. Few leaders know numbers as well Cook does. "Our adoption rate is industry leading as well," Cook continued.
Cook isn't the only Apple presenter who follows the formula. According to Federighi, the new OS allows phones to unlock FaceID 30 percent faster, downloads are 50 percent smaller, and updates are 60 percent smaller--all making apps a faster experience. Інтернет-ресурси для створення інфографіки до уроку — Журнал «На Урок» Огляд зручних онлайн-платформ, за допомогою яких можна безкоштовно швидко створити яскраву інфографіку до будь-якого уроку.
А чи знали ви, що наш мозок опрацьовує зображення у 60 000 разів швидше, ніж текст? При цьому більшість людей краще відтворює саме візуальну інформацію. Проведіть з учнями експеримент: запропонуйте прочитати параграф із підручника та розберіть зміст прочитаного, а потім поясніть інший програмний матеріал, супроводжуючи пояснення певним схематичним зображенням, бажано емоційними. Community.articulate. For Education. 6 PowerPoint Alternatives for Presentations. Zanifesto. Bulb Digital Portfolios for Education. Web Whiteboard. CamStudio - Free Screen Recording Software.
10 Web Tools and Apps for Creating Screencast Videos. “We need technology in every classroom and in every student and teacher’s hand, because it is the pen and paper of our time, and it is the lens through which we experience much of our world.” – David Warlick Creating a video of one’s screen (screencasting) is a powerful way to demonstrate knowledge.
Our students can create how-to videos to teach others how to use favorite web tools or to demonstrate a process. Students can use screencasting tools with whiteboards to show how to complete an equation, to create visual word problems, or explain a theory. Teaching others is one of the most powerful ways to learn and the first mission in my new book, Hacking Digital Learning Strategies: 10 Ways to Launch EdTech Missions. What follows are a list of free web tools and apps to record a desktop, mobile screen, or whiteboard. Get your copy of Hacking Digital Learning, The 30 Goals Challenge, or Learning to Go. New Presentation Software - Online Powerpoint Alternative - Niftio. TheLearnia - Free Online Whiteboard. 7 Awesome Pattern Backgrounds for Your Slides and How to Create Them in PowerPoint. Teaching ESL Presentation Skills: How to Structure an Excellent Presentation. Recap. Infographics in the Classroom Teacher Toolkit.
Next Generation Science Standards Analyzing and Interpreting Data Middle School [Note: this Practice can be incorporated into an infographics lesson when the students analyze and graph a data set in order to identify patterns in the data.
The first middle school standard can also be addressed by having students interpret the story told by an existing infographic.] Construct, analyze, and/or interpret graphical displays of data and/or large data sets to identify linear and nonlinear relationships.Use graphical displays (e.g., maps, charts, graphs, and/or tables) of large data sets to identify temporal and spatial relationships. High School Analyze data using tools, technologies, and/or models (e.g., computational, mathematical) in order to make valid and reliable scientific claims or determine an optimal design solution. LiveSlides - Embed any web content in a PowerPoint presentation. TheLearnia - Free Online Whiteboard. 20+ Tools to Create Your Own Infographics.
A picture is worth a thousand words – based on this, infographics would carry hundreds of thousands of words, yet if you let a reader choose between a full-length 1000-word article and an infographic that needs a few scroll-downs, they’d probably prefer absorbing information straight from the infographic. What’s not to like? Colored charts and illustrations deliver connections better than tables and figures and as users spend time looking back and forth the full infographic, they stay on the site longer. Plus, readers who like what they see are more likely to share visual guides more than articles. While not everyone can make infographics from scratch, there are tools available on the Web that will help you create your very own infographics. In this article, we’re listing more than 20 such options to help you get your messages across to your readers, visually.
SLIDEDOC PowerPoint Templates by Duarte ... A Game Changer? By Adam Noar Most IN-PERSON presentations today follow a pretty simple formula: One Idea Per SlideEliminate TextShow (Not Tell)Choose Stunning ImagesUse Colors WellAt Most 2 Fonts (Maybe 3)Fight For Whitespace However, what do you do when the presentation you’re developing is meant to be used both as a written report and as part of a live presentation?

In an ideal world, you would simply prepare two distinct deliverables: 1. 2. Here’s the problem … In reality, creating BOTH of these almost NEVER happens. PowerPoint Versus Visme: Which One Is Right For You? Anyone who has ever had to give a presentation in their life has at some point used PowerPoint.
Although speakers and presenters around the world have rebelled against its ubiquitous presence across boardrooms and classrooms (just read here, here and here), the fact that it has been around for so long makes it difficult to break the old habit of creating a PowerPoint slide deck every time we have to give a pitch or talk. To help you break free from the reluctance to try something new, we’ve created a series of short videos that will allow you to compare certain Visme features and functions with those found in PowerPoint. These visual comparisons will give you the information you need to select the presentation tool that best fits your needs. (To watch each video in full-screen mode, just click on the maximize button to the bottom right.) Presentation Design: 15 Ways to Deliver the Perfect Message. To persuade, inspire, or inform with a presentation requires well organized and perfectly tailored content.
Presenter. Use of web tools for creating and sharing multimedia presentations. Диаграмма без названия.xml - draw.io. Create Interactive Online Presentations, infographics, animations & banners in HTML5 - Visme by Easy WebContent. Narration over Google Slides. Digital Image Factory: All Pics. Create Interactive Online Presentations, infographics, animations & banners in HTML5 - Visme by Easy WebContent.
Create HTML5 Interactive Presentations, Animations, infographics & banners - HTML5 Presenter by Easy WebContent. Emaze - Amazing Presentations in Minutes. Create Amazing Interactive Presentations From Your Browser With Emaze. PowerPoint Design Pros of PPT. Online Presentation Tools. Glogster EDU - 21st century multimedia tool for educators, teachers and students. Presentations with voice. Edcanvas - The one place for teachers to create and deliver lessons digitally. Little Bird Tales - Home. Prezi - Ideas matter.