
What is Hadoop? – Bring the power of Hadoop to the enterprise with IBM. About Hadoop® Apache™ Hadoop® is an open source software project that enables the distributed processing of large data sets across clusters of commodity servers.
It is designed to scale up from a single server to thousands of machines, with a very high degree of fault tolerance. Rather than relying on high-end hardware, the resiliency of these clusters comes from the software’s ability to detect and handle failures at the application layer. Interactive: Snake Oil Supplements? The scientific evidence for health supplements.
See the data: bit.ly/snakeoilsupps.

See the static versionSee the old flash version Check the evidence for so-called Superfoods visualized. Note: You might see multiple bubbles for certain supplements. These is because some supps affect a range of conditions, but the evidence quality varies from condition to condition. For example, there’s strong evidence that garlic can lower blood pressure. How your smartphone betrays you all day long. Ton Siedsma, a lawyer for the Dutch civil liberties group Bits of Freedom, volunteered to have a week's worth of his phone's metadata collected and analyzed by researchers from Ghent University and by Mike Moolenaar.
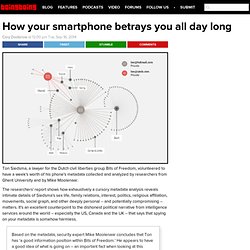
The researchers' report shows how exhaustively a cursory metadata analysis reveals intimate details of Siedsma's sex life, family relations, interest, politics, religious affiliation, movements, social graph, and other deeply personal -- and potentially compromising -- matters. It's an excellent counterpoint to the dishonest political narrative from intelligence services around the world -- especially the US, Canada and the UK -- that says that spying on your metadata is somehow harmless.
Based on the metadata, security expert Mike Moolenaar concludes that Ton has ‘a good information position within Bits of Freedom.’ He appears to have a good idea of what is going on – an important fact when looking at this network from an intelligence perspective. How CIOs can lead their company’s information business. Companies across industries are placing major bets on big data, expecting it could dramatically improve business processes and overall performance.
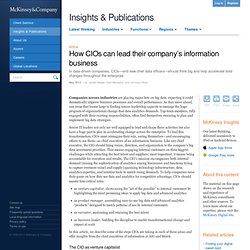
As they move ahead, one issue that looms large is finding senior-leadership capacity to manage the huge program of organizational change that data analytics demands. Top-team members, fully engaged with their existing responsibilities, often find themselves straining to plan and implement big data strategies. Senior IT leaders not only are well equipped to lead and shape these activities but also have a huge part to play in accelerating change across the enterprise. XMILE – An open standard for system dynamics models. In June, isee systems and IBM sponsored a new technical committee in OASIS, a large standards organization.

This committee is developing a new system dynamics modeling standard called XMILE. This blog post will answer some important questions about XMILE. Big Data has a Big Problem. Spurious Correlations finds the hidden, totally pointless connections between everything. Spurious Correlations is the virtual embodiment of a useful rhetorical cudgel: correlation does not equal causation.
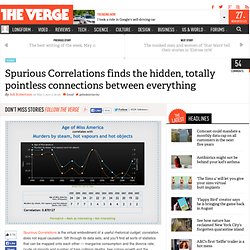
Sift through its data sets, and you'll find all sorts of statistics that can be mapped onto each other — margarine consumption and the divorce rate, crude oil imports and number of train collision deaths, bee colony growth and the marriage rate. If you ever need to demonstrate that two things can appear connected purely by chance or some entirely separate factor, this is your site.
If you need "news of the weird" fodder and are willing to play fast and loose with the facts, the charts are still technically accurate. The clever thing about Spurious Correlations is that it's fairly transparent about how it generates relationships. Happy Planet Index. Map showing countries shaded by their position in the Happy Planet Index (2006).
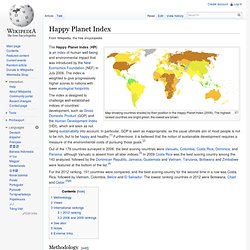
The highest-ranked countries are bright green; the lowest are brown. The index is designed to challenge well-established indices of countries’ development, such as Gross Domestic Product (GDP) and the Human Development Index (HDI), which are seen as not taking sustainability into account. In particular, GDP is seen as inappropriate, as the usual ultimate aim of most people is not to be rich, but to be happy and healthy.[1] Furthermore, it is believed that the notion of sustainable development requires a measure of the environmental costs of pursuing those goals.[2] Out of the 178 countries surveyed in 2006, the best scoring countries were Vanuatu, Colombia, Costa Rica, Dominica, and Panama, although Vanuatu is absent from all later indices.[3] In 2009 Costa Rica was the best scoring country among the 143 analyzed, followed by the Dominican Republic, Jamaica, Guatemala and Vietnam.
Methodology[edit] Pros: Cons: Critical Skills for Future Data Scientists. Data Mining With the continued explosion of data, the proliferation of complexity throughout the information management lifecycle, and the pressing need for organizations to derive revenue-generating insights from their data and information, the role of the data scientist has been thrust into the spotlight, fast becoming one of the most talked about and sought after roles in all of IT.
At the same time, the industry wide shortage of data scientists, combined with reported six-figure salaries, is creating a ripple through existing IT ranks as programmers, application developers and engineers look to climb the corporate ladder by becoming data scientists. They’re part technologist, scientist, investigative researcher, business analyst, mathematician, statistician, economist, and engineer. So, what critical skills do IT professionals need to develop if they are going to grow into future data scientists? Curiosity. Views from the front lines of the data-analytics revolution. This past October, eight executives from companies that are leaders in data analytics got together to share perspectives on their biggest challenges.
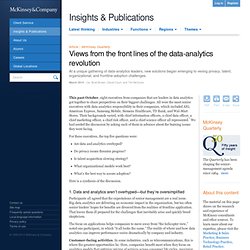
All were the most senior executives with data-analytics responsibility in their companies, which included AIG, American Express, Samsung Mobile, Siemens Healthcare, TD Bank, and Wal-Mart Stores. Their backgrounds varied, with chief information officers, a chief data officer, a chief marketing officer, a chief risk officer, and a chief science officer all represented. We had seeded the discussion by asking each of them in advance about the burning issues they were facing. For these executives, the top five questions were: Are data and analytics overhyped? Here is a synthesis of the discussion. Information aesthetics - Data Visualization & Information Design. An MIT Project That Lets You Spy On Yourself : Planet Money. Of all the stuff on metadata I've seen in the past few weeks, this is my favorite: This is my (Gmail) life.
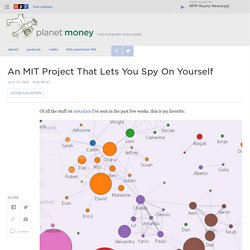
Immersion.mit.media.edu hide caption itoggle caption immersion.mit.media.edu It's my favorite in large part because it's my metadata. It comes from my Gmail account. Big Data. Big Data. When Competition Shifts From the Known to the Unknown. 'Geography of Hate' maps racism and homophobia on Twitter. Twitter, even more than many other social media tools, can feel disconnected from the real world. But a group of students and professors at research site Floating Sheep have built a comprehensive map of some of Twitter's most distasteful content: the racist, homophobic, or ableist slurs that can proliferate online. Called Geography of Hate, the interactive map charts ten relatively common slurs across the continental US, either by general category or individually.
Looking at the whole country, you'll often see a mass of red or what the map's creators call a "blue smog of hate. " Solving Equation of a Hit Film Script, With Data. Loyalty Lab. Last week, we gave you an overview of David Rosen’s webinar focusing on The Power of Analytics to Drive Loyalty. This week, we would like to dive a little deeper into one of the most interesting and pressing topics he discussed: segmentation models that marketers have the opportunity to apply when managing and analyzing their loyalty campaigns. In the Webinar, Rosen breaks down segmentation into three approaches and highlights their benefits: 1. Profitability Segmentation Prioritizes and manages members in order to increase profits and retain customersFocuses on a bottom-up value calculation model that takes into account actions and accrualsDrives program activity, targeting APIs.
Special Topics: Sensemaking. This is a seminar-style exploration that will focus on integrating knowledge from cognitive psychology, social psychology, social computing, machine learning and computer science that can help people make sense of overwhelming amounts of information. The amount of information available to individuals today is enormous and rapidly increasing—70 billion hours are spent—and lost—every year on online sensemaking tasks (such as search) in the U.S. alone. Research: Overview - United States. Using Entity Analytics to Greatly Increase the Accuracy of Your Models Quickly and Easily.
Analysts routinely face steep challenges as they attempt to integrate diverse enterprise-wide data. This statement is especially true when this data contains natural variability (for example, Bob versus Robert), unintentional errors (such as a transposed month and day in a date of birth) and professionally fabricated lies (such as a fake identity).
88 Acres. Ethnologue. Maps of Science: Forecasting Large Trends in Science - Detail - Places and Spaces. Population Reference Bureau & World Population Growth. How many people have ever lived on Earth? Real Time World Statistics. Worldometers - real time world statistics. World Development Indicators - Google Public Data Explorer. Big data: The next frontier for innovation, competition, and productivity. 30 Ways to Boundary for Application Monitoring. A Few Early Cloud Computing Mavericks. Szűcs Krisztina grafikus portfólió. New Media Trend Watch - Provided by the European Travel Commission.
Geopolitical Monitoring: News Visualization, I&W & More.