
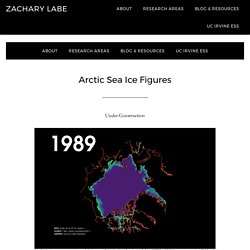
Arctic Sea Ice Graphs. Cartes des analyses - Environnement Canada. Garde côtière canadienne - Région du Centre et de l’Arctique (MarInfo) - Cartes d'observation des glaces. Zack Labe (@ZLabe) Arctic Sea Ice Figures. Under Construction A look at Arctic sea ice concentration over the last 100 years (September, through 2013) using the latest NSIDC gridded 1850- reconstruction from Walsh et al. [2016].
The discontinuity between 1978-1979 is the transition to the passive microwave satellite era. Trends in sea ice thickness/volume are another important indicator of Arctic climate change. While sea ice thickness observations are sparse, here we utilize the ocean and sea ice model, PIOMAS (Zhang and Rothrock, 2003), to visualize October sea ice thickness from 1979 to 2017. Sea ice less than 1.5 meters is masked out (black) to emphasize the loss of thicker, older ice. CycloneXtrème - Météo Cyclone Ouragan Typhon Tempête. Daily Updated Time series of Arctic sea ice area and extent derived from SSMI data provided by NERSC. Paul Beckwith (@PaulHBeckwith)
1/12° Arctic Cap Nowcast/Forecast System (ACFNS) Monitoreo Global Hoy. EPS Model - Tropical Tidbits. This page supplies graphical forecasts from numerical weather models.
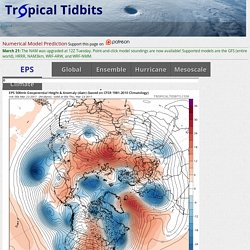
Global models with imagery for the entire world include the ECMWF, GFS, CMC, NAVGEM, and their associated ensemble prediction systems. Mesoscale models for the United States include the NAM in various forms and the Canadian RGEM. A global map of wind, weather, and ocean conditions.