
Bureau of Met reads tea leaves and finds warming at Horn Island that no thermometer can see. Magically correcting Australia’s thermometers from 1,500 kilometers away. The Australian Bureau of Meteorology uses “surrounding” thermometers to adjust for odd shifts in data (caused by things like long grass, cracked screens, or new equipment, some of which is not listed in the site information).
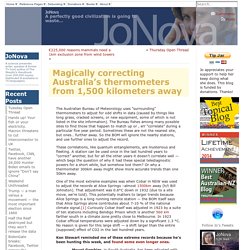
The Bureau fishes among many possible sites to find those that happen to match up or , err “correlate” during a particular five year period. Sometimes these are not the nearest site, but ones… further away.
Blog - Jennifer Marohasy. Homogenisation: The Magical system which uses thermometers in Victoria to correct the temperature in Tasmania. Lots of things can muck up a perfect thermometer spot, like shade, new roads, new screens, or old paint.
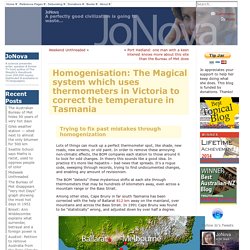
In order to remove these annoying non-climatic effects, the BOM compares each station to those around it to look for odd changes. In theory this sounds like a good idea. In practice it’s more like hepatitis – bad news that spreads. It’s a rogue code, sweeping through records, trying to find undocumented changes, and enabling any amount of revisionism. Announcing BomWatch: Auditing the fake warming created by site changes near the Great Barrier Reef. Fake Warming in Queensland: The BOM says the sites didn’t move, but photos show they did.
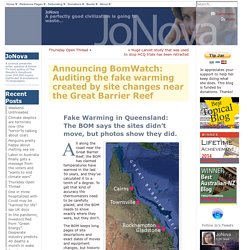
The warming at these four sites alongside the Great Barrier Reef is due to site changes, incompetence, poor record keeping and “adjustments”. Map: Terrametrics, Map data Google 2020. Warming Marble Bar. Reposted from Jennifer Marohasy’s Site March 1, 2020 By jennifer MY friend Craig Kelly – the Federal member for Hughes – attempted to raise the issue of the world’s longest heat wave record in the Australian parliament last Wednesday.
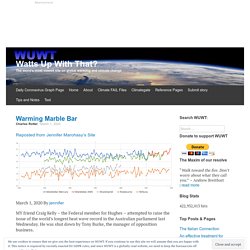
He was shut down by Tony Burke, the manager of opposition business. Specifically, Mr Kelly was attempting to draw attention to how the historical observations have been changed, and how the values as originally recorded at Marble Bar between 31 October 1923 and 7 April 1924 have been adjusted down. This was first brought to our attention by Chris Gilham, and reposted by Joanne Nova. ACORN adjustments robbed Marble Bar of its legendary world record. Death Valley now longest hottest place. UPDATE: The Hon.
Craig Kelly MP was so appalled by this story he has taken this to the Australian Parliament already where The Labor Party was so afraid they interrupted his allocated 15 minute speech just to stop him finishing. They even called a formal Division which means the bell is rung and all the missing MPs have to return to the Chamber to vote. See that on Kelly’s Facebook page. Who cares about our climate and who covers up for incompetent bureaucrats?! For generations it was a Guinness Book of Records type thing. In 1924 Marble Bar set a world record of the most consecutive days of 100 °F (37.8 °C) or above, during an incredible period of 160 days starting in 1923. Chris Gillham wonders how the bureau figured out the Marble Bar max was one whole degree too warm on 18 Nov 1923, but it was 0.6°C too warm on 19 Nov 1923, 0.3°C too warm on 20 Nov 1923, 0.2°C too warm on 21 Nov 1923, and 0.8°C too warm on 22 Nov 1923?
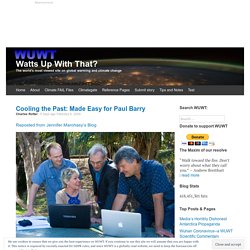
Cooling the Past: Made Easy for Paul Barry. Reposted from Jennifer Marohasy’s Blog February 6, 2020 By jennifer It is not disputed that Blair Trewin under the supervision of David Jones (both working at the Australian Bureau of Meteorology) remodel all the historical temperature data generating trends and statistics that look quite different from the actual measurements.
The remodelled series are then passed on to university and CSIRO climate scientists who base much of their climate research on these ‘second-hand’ statistics. So, when Michael Mann and David Karoly tell you it’s getting hotter and hotter, this is their interpretation of Blair Trewin’s statistics, not their interpretation of the actual data.
When I say there needs to be more scrutiny of what Blair does to the actual measurements, I’m simply making a request. Smoke And Deception Blanket Australia: NASA GISS Fudges Data, Cooling Turns Into Warming. By Kirye and P Gosselin We’ve been hearing much fake news about the Australian bush fires supposedly having been caused by man-made climate change.

Yet it has emerged that Australian authorities were warned years ago that poor land management practices were in fact escalating the risk of devastating fires, according to an expert. Forest fuel level highest in 1000 years In 2015, bush fire scientist David Packham warned of a “huge blaze threat” and urged an “increase in fuel reduction burns”. “Forest fuel levels had climbed to their most dangerous level in thousands of years,” wrote Darren Gray here in 2015. The BEST and worst of ACORN-SATv2 Tmins. Guest article by Dr Michael Chase Map above: Changes in minimum temperatures (Tmin) in Australia since 1910, according to the Australian Bureau of Meteorology (BoM) “It was the BEST of tmins, it was the worst of tmins” … apologies to Charles Dickens.
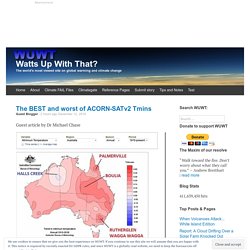
This article is about why the BoM map shown above has warm and cold spots, including a somewhat implausible cooling region near Halls Creek in Western Australia. A four-pronged validation analysis is being mounted against version 2 of ACORN-SAT, intended by the BoM to indicate how air temperatures in Australia have varied from 1910 to the present time. The four prongs are as follows: · Consistency with near neighbours. Excuses? Coldest Summer day, Snow in Australia and suddenly BOM remembers how inadequate their equipment is… Snow in December: Has Australia installed too many solar panels?
Climate Change brings summer snow to Australia Kate Doyle, ABC News On Monday, the second day of summer, the temperature only reached -1 degrees Celsius at the Thredbo weather station, the coldest maximum temperature recorded anywhere in Australia during summer. But really cold records don’t matter. The Mysterious Warmth at Mackay. Guest article by Dr Michael Chase Map above: Changes in maximum temperatures (Tmax) in Australia since 1910, according to the Australian Bureau of Meteorology (BoM) SCOPE and PURPOSE At face value this article is about why the region of Australia centred on the city of Mackay in Queensland has appeared to have warmed more than its surroundings since 1910.
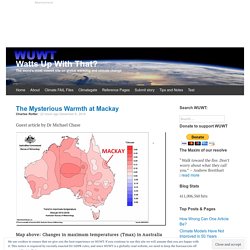
The short answer is that this hotspot, and almost certainly all the other hot and cool spots on the BoM map shown above, reflect errors in homogenised data. This article starts by revealing clear and irrefutable errors for the specific example of Mackay, with minimal explanation, and then goes on to provide some technical details of the analysis method. Whopper part II: Look what the BoM did to the last three Februarys in Australia?! The Bureau of Meteorology did what to February? Wow, just wow. Look what the Bureau of Meteorology has covertly done to February?
Something like one third of a degree has been added to the average Australian summer maximum anomalies over the past few years according to the “expert” data from the worlds-best-practise equipment. Shrinking Stevenson Screens cause global warming (and peeling paint, long grass…) The Australian BOM has lost its way Australia’s Bureau of Meteorology is paid more than a million dollars a day, and the planet is under seige, yet the paint is peeling off some Australian thermometer screens, the grass is long, and wasps are nesting in them.
What once were large 230 litre wooden boxes have shrunk to 60 litres and are now even turning to plastic. The old glass thermometers are being replaced with electronic gear that can record a burst of hot air — yet somehow those freak high spikes are supposed to be comparable to temperatures recorded 100 years ago by slow glass thermometers. Old larger boxes protected thermometers from sudden changes in air temperature. Left: Len Walker with a 230L screen in 1940. Australian legislator uncovers that country’s Bureau of Meteorology fiddling with temperature records to hype warming. By Paul Homewood The Australian BOM have been caught red handed again, fiddling with temperature records: If global warming is real and a threat to the world, why do people keeping temperature records keep "adjusting" or "rectifying" the data to make it look like warming is increasing?
Who knew? The Australian Bureau of Met just made last summer hotter, and history colder (again) The cheapest way to prevent man-made global warming is stop the BOM altering the data First the BoM had “high quality” data. Then, with fanfare, after we asked for an audit they had the miracle of ACORN circa 2011. Then early this year ACORN 2.0 was quietly birthed with major adjustments as expert data became “more expert” but the BOM strangely didn’t want to mention that what was so good is now even better (apparently). The unofficial BOM audit team — especially Bob Fernley-Jones and Chris Gillham — have unearthed just how large the latest rewrite of history is. These men are truly independent, they have no funding, and nothing to gain either way.
Port Hedland: one man with a keen interest knows more about this site than the Bureau of Met does. The Case of the Disappearing Data – CO2 is Life. Just a few weeks ago we made a post about an easy High School Experiment to debunk global warming: An Easy High School Experiment to Debunk CO2 Driven Climate Change In it, we describe going to NASA GISS and explore for Stations that existed back in 1902, are in the middle of nowhere, and have a BI value of 10 or less.
The Bureau of Met disappears “Very Hot Days” graph showing the most hot days in 1952. Here’s an inconvenient fact: Australia had the highest number of very hot days in 1952, back when CO2 levels were 311ppm and humans had not yet emitted 87% of our carbon dioxide emissions. Hiding The Heat At Alice Springs. Hiding The Heat At Bourke. Hiding The Heat At Bathurst. Hiding The Heat At Wagga Wagga. Hiding The Heat At Cape Otway. Australia Shows No Warming Since 1876. Albany robbed of its coldest ever April day, BOM adjusts temp up 15 degrees C?! Friday April 19th set more records than anyone realized. DARWIN TEMPERATURES: UNSCRAMBLING THE ACORN SAT 2 SERIES. By Bob Irvine. Darwin Temperatures; What is going on? By Bob Irvine. Changes to Darwin’s Climate History are Not Logical - Jennifer Marohasy. If they change recorded historical temperature records to increase modern apparent warming, it changes nothing in the, long term, natural climate cycles. Climate change is natural, normal, necessary and unstoppable.
Dr Curry wrote on Climate Etc: “Attribution studies estimate that about a half (40–54%) of the global warming from 1901 to 1950 was forced by a combination of increasing greenhouse gases and natural forcing, offset to some extent by aerosols. Natural variability also made a large contribution. ACORN-SAT 2.0: Tasmania- May the Farce be with you. Australia Surface Temperatures Compared to UAH Satellite Data Over the Last 40 Years. Reposted from Dr. The ‘trick’: How More Cooling Generates Global Warming.
An Intriguing Look At Temperatures In Australia. Data mangling: BoM’s Changes to Darwin’s Climate History are Not Logical. Bureau Rewrites History – Again, at Albany - Jennifer Marohasy. The Greatest Scientific Fraud Of All Time. Another bureau rewrite warms Australia’s climate history. By Chris Gilham, The Greatest Scientific Fraud Of All Time. History keeps getting colder — ACORN2 raises Australia’s warming rate by over 20% Australian Met Office Accused Of Man-Made Climate Change - The Global Warming Policy Forum (GWPF) Another bureau rewrite warms Australia’s climate history.
Pretty Patterns. BOM homogenization errors are so big they can be seen from space. Temperatures Trends, Southeast Australia from 1887 – Part A - Jennifer Marohasy. Homogenization of temperature data makes Capetown South Africa have a warmer climate record. Rutherglen - Jennifer Marohasy. Corrupted Australian Surface Temperature Records. Australian Met Office Accused Of Manipulating Temperature Records. All Warming In NSW And Victoria Is Due To UHI. Summer Temperatures in South-Central Queensland Part 1: Diurnal Patterns of Temperature Change.
Summer Temperatures in South-Central Queensland Part 2: Weather Events and Spikes. Watch an AWS Fail. Australian Temperature Data Are Garbage. Garbage In, Garbage Out.