
Study Shows Arctic Sea Ice Reached Lowest Point On Modern Record… In The 1940s, Not Today! If Al Gore had been an activist in the 1940s, he would have certainly predicted an ice-free Arctic by 1960, or at least by 1980.
And of course, as usual, he would have been wrong. Al Serial-Exaggerator Gore gets exposed again Back in the 1930s and 40s, the globe had been warming at a rate that we’ve see over the most recent 30 years. There were newspaper articles back then reporting on a rapidly melting Arctic. Arctic Temps Show Little Change Over Past 90 Years, In Sync With Oceanic Surface Temperature Cycles. Data show Arctic more stable than media doomsayers portray it to be.

In the latter part of the latest Klimaschau video, Arctic mean temperature trends above 70°N are examined: The first chart (8:38) goes back to 2000. Though the running 37-month average rose until 2006, it’s been steady ever since: Source: climate4you Over the last five years, the plot in fact shows some cooling off. No real warming since the 1930s Next, looking back longer term, we examine the data going back 100 years: Study Shows Arctic Sea Ice Reached Lowest Point On Modern Record… In The 1940s, Not Today!
Sea Ice Same Thickness As 60 Years Ago. Absence of evidence for greenhouse warming over the Arctic Ocean-Mark Serreze 1990. By Paul Homewood We are familiar with the incessant claims that the Arctic is one of the fastest warming regions on Earth, and that this is due to the polar amplification effect of greenhouse gases.
But scientists back in the 1990s found that this theory did not stack up then: Abstract ATMOSPHERIC general circulation models predict enhanced greenhouse warming at high latitudes1 owing to positive feedbacks between air temperature, ice extent and surface albedo2–4. Previous analyses of Arctic temperature trends have been restricted to land-based measurements on the periphery of the Arctic Ocean5,6.
The cooling between 1950 and 1990 is very evident at a whole range of land sites on the fringes of the Arctic, ranging from Greenland right through to eastern Siberia. Ironically one of the authors, Mark Serreze, is now one of the leading cheerleaders for Arctic death spirals and the like. No Trend In Early W. Hudson Bay Ice Breakup For Last 20 Years. Published on June 27, 2019 Written by Susan J Crockord PhD Straight from the horse’s mouth: all polar bear females tagged by researchers around Churchill in Western Hudson Bay last year were still on the ice as of 25 June.
With plenty of ice still remaining over the bay, spring breakup will be no earlier this year than it has been since 1999. Data Show Polar Sea Ice Stable 12 Years, Cause Global Warming Alarmists To Melt Down. By Kirye and P.
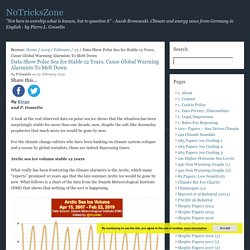
Gosselin A look at the real observed data on polar sea ice shows that the situation has been surprisingly stable for more than one decade, now, despite the cult-like doomsday prophecies that much more ice would be gone by now. For the climate change cultists who have been banking on climate system collapse and a rescue by global socialists, these are indeed depressing times. Arctic Sea Ice Melt Rates Continue To Decline. Over the past 15 years, the amount of sea ice melting between May 1 and July 25 has plummeted.
This is not surprising, because Arctic summers have been getting colder. Observational Evidence Reveals Regional Arctic Sea Ice Was Thinner In 1955 Than In 2015-’17! By Kenneth Richard on 18.
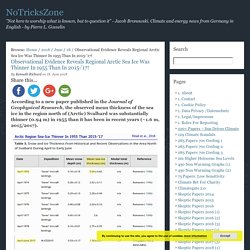
June 2018 According to a new paper published in the Journal of Geophysical Research, the observed mean thickness of the sea ice in the region north of (Arctic) Svalbard was substantially thinner (0.94 m) in 1955 than it has been in recent years (~1.6 m, 2015/2017). Graph Source: Rösel et al., 2018 In 1955, the atmospheric CO2 concentration hovered around 315 ppm, about 90 ppm lower than today’s CO2 values.
New ‘Consensus’ Science: HALF Of 1979-Present Arctic Warming & Ice Loss Is Natural. By Kenneth Richard on 19.
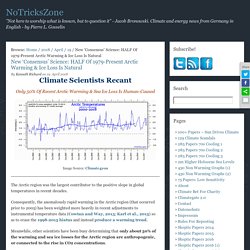
April 2018 Only 50% Of Recent Arctic Warming & Sea Ice Loss Is Human-Caused Image Source: Climate4you The Arctic region was the largest contributor to the positive slope in global temperatures in recent decades. Consequently, the anomalously rapid warming in the Arctic region (that occurred prior to 2005) has been weighted more heavily in recent adjustments to instrumental temperature data (Cowtan and Way, 2013; Karl et al., 2015) so as to erase the 1998-2015 hiatus and instead produce a warming trend.
Cache of historical Arctic sea ice maps discovered. Arctic Sea ice data collected by DMI 1893-1961 Guest post by Frank Lansner I came across a number of maps showing Arctic ice extend from 1893 to 1961 collected by DMI in “Nautisk Meteorologisk Aarbog”.
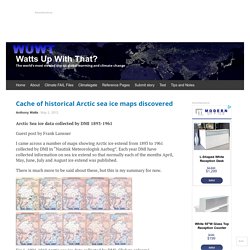
Each year DMI have collected information on sea ice extend so that normally each of the months April, May, June, July and August ice extend was published. There is much more to be said about these, but this is my summary for now. Today’s Arctic Compares with 150 years ago. Imagery date refers to Google Earth capture of land forms.

Ice extent is for August 31, 2016 from MASIE. Serenity is docked at Devon Island. Click to zoom in. Researchers found that ice conditions in the 19th century were remarkably similar to today’s, observations falling within normal variability. The study is Accounts from 19th-century Canadian Arctic Explorers’ Logs Reflect Present Climate Conditions (here) by James E. Overview. Historic Variation in Arctic Ice. Historic Variation in Arctic Ice Guest post from the Air Vent by Tony B The following is a guest post by Tony B on the history of Arctic ice.
I nominated him Arctic ice historian on WUWT when I noticed he had done a considerable amount of research. Happily he took me up on it and has put a lot of work into this. Historic Variations in Arctic Sea Ice – Part Two. Guest essay by Tony brown Foreword Note; Last year an edited version of this article appeared at Climate Etc. This new version contains numerous additional references, graphics, quotes, more historic detail and updates. Bad Science: NSIDC disappears Arctic sea ice extent going back years. From the “Arctic is screaming louder thanks to Mark Serreze and his adjustment shenanigans” department, I don’t think this is going to fly. Some of the adjustments are as much as 1.2 million square kilometers of sea ice, which is as much as some yearly variations. -Anthony Guest essay Tom Wiita I came across this month’s page posted at the NSIDC web site detailing the sea ice findings for the current month.
It mentioned a revision to the way NSIDC calculates the sea ice area which was made last month. As a veteran NSIDC-watcher, before reading the page I made a falsifiable prediction bet with myself. Would you believe it, I won my bet! Understanding The Difference Between Climate And Weather. Climate experts tell me that I don’t understand the difference between climate and weather, and that Alaska is the global warming canary in the coal mine.
Popular Science says Alaska is warming so quickly that computers (which can do billions/trillions of calculations per second) simply can’t keep up. Alaska is warming so quickly that weather algorithms can’t keep up | Popular Science In order to help readers understand the difference between weather and climate, I prepared these diagrams. Red areas represent climate, and blue areas represent weather. “Climate change” is causing the jet stream to currently be shifted just east of the Alaska border, with very cold air covering most of Canada and Greenland. 10-Day Temperature Outlook Ninety five years ago, Popular Science warned that the Eastern Arctic was suffering a radical change in climate conditions with unheard of high temperatures, and that the North Pole was going to be ice free. 07 Apr 1923 – NORTH POLE MELTING. – Trove.
NYT contradicts itself on Arctic warming. Three Decades of Sea Ice Cover Trends in the Bohai Sea. Paper Reviewed Yan, Y., Shao, D., Gu, W., Liu, C., Li, Q., Chao, J., Tao, J. and Xu, Y. 2017. Multidecadal anomalies of Bohai Sea ice cover and potential climate driving factors during 1988-2015. Environmental Research Letters 12: 094014.