
Data Visualization Review: Gephi, Free Graph Exploration Software. I do not often get to play with networks, yet I find them fascinating and full of knowledge gathering potential.
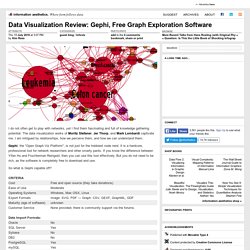
The data visualization works of Moritz Stefaner, Jer Thorp, and Mark Lombardi captivate me. I am intrigued by relationships, how we perceive them, and how we can understand them. Gephi, the "Open Graph Viz Platform", is not just for the hobbiest node nerd. It is a hardcore, professional tool for network researchers and other smarty pants. Gephi, an open source graph visualization and manipulation software. Data visualisation. Free Data Visualization Software. iCharts. 20+ Tools to Create Your Own Infographics. A picture is worth a thousand words – based on this, infographics would carry hundreds of thousands of words, yet if you let a reader choose between a full-length 1000-word article and an infographic that needs a few scroll-downs, they’d probably prefer absorbing information straight from the infographic.
What’s not to like? Colored charts and illustrations deliver connections better than tables and figures and as users spend time looking back and forth the full infographic, they stay on the site longer. Plus, readers who like what they see are more likely to share visual guides more than articles. While not everyone can make infographics from scratch, there are tools available on the Web that will help you create your very own infographics. How To Create Outstanding Modern Infographics. In this tutorial you will learn that data doesn't have to be boring, it can be beautiful!

Learn how to use various graph tools, illustration techniques and typography to make an accurate and inspiring infographic in Adobe Illustrator. Start by using the Rectangle Tool (M) to draw a shape. Give it a subtle radial gradient too. 10 Awesome Free Tools To Make Infographics. Advertisement Who can resist a colourful, thoughtful venn diagram anyway?

In terms of blogging success, infographics are far more likely to be shared than your average blog post. This means more eyeballs on your important information, more people rallying for your cause, more backlinks and more visits to your blog. Online Diagram Software and Flowchart Software - Gliffy. Exhibit. GeoCommons.
Weave. d3 gallery. Wiki ▸ Gallery Welcome to the D3 gallery!

More examples are available for forking on Observable; see D3’s profile and the visualization collection. Please share your work on Observable, or tweet us a link! Create A Graph. 8 Terrific Web Tools for Finding and Creating Data Visualizations. April 9, 2014 I got an email yesterday from a teacher asking about web tools that her students can use to create mapped data sets and visual representations of data.
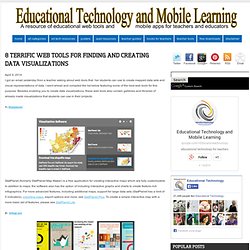
I went ahead and compiled the list below featuring some of the best web tools for this purpose. Besides enabling you to create data visualizations, these web tools also contain galleries and libraries of already made visualizations that students can use in their projects. 1- Statplanet StatPlanet (formerly StatPlanet Map Maker) is a free application for creating interactive maps which are fully customizable. Chart Tools.