
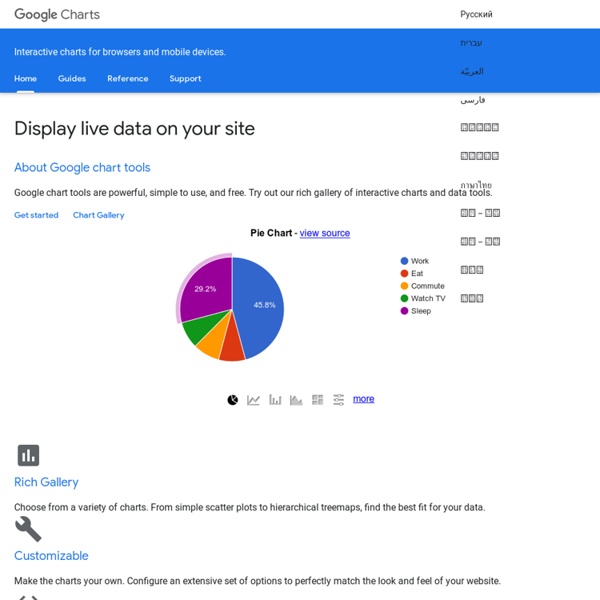
https://developers.google.com/chart
Related: ToolsLive Tools - Button Builder Global Settings Button Label Padding Font Size Cross-Browser JavaScript/HTML5 Charts - dhtmlxChart dhtmlxChart is a JavaScript charting library for generating cross-browser HTML5 charts. It supports the most common chart types: line, spline, area, bar, pie, donut, scatter, and radar charts. For complex charting needs, you can create a chart series, plotted separately side by side, or stacked. You can also display a combination of different charts types on a single chart (e.g. combine line and bar charts). The charts can be loaded from XML, JSON, JavaScript array, or CSV and updated on the fly (by using Ajax) to show changing graphical data. You can easily customize the chart appearance by configuring any chart elements: colors, tooltips, scales, templates, labels, etc.
How to Create an Excel Dashboard - The Excel Charts Blog The Excel Charts Blog Excel dashboards and executive reports are powerful, fairly easy to design and a great way to improve your Excel and data visualization skills. Because of its flexibility, you can virtually design any dashboard in Excel exactly the way you, or the users, imagined. And, best of all, you may want to implement it yourself or consider it a prototype and ask IT to implement it. Once you know what will the Excel dashboard be used for and what kind of metrics users expect, there are three major areas that you must address when creating it: how to bring data into your spreadsheets;how to manage the data and link it to the dashboard objects, like charts and tables;how to design the dashboard report.
Crossfilter Fast Multidimensional Filtering for Coordinated Views Crossfilter is a JavaScript library for exploring large multivariate datasets in the browser. Crossfilter supports extremely fast (<30ms) interaction with coordinated views, even with datasets containing a million or more records; we built it to power analytics for Square Register, allowing merchants to slice and dice their payment history fluidly. CSS Chart Generator - create CSS Charts on the fly! Below you can enter all the necessary information for your chart. The single items are explained and predefined, so you can simply start changing values. When you are done adding your values, simply click the send button and your chart will be generated in no time and you will receive a link which you can use to display the chart on your page. Please note, the animation effect is not included, but you can download the necessary ajax code. The free version shows a copyright notice in the x-axis title, while the pro version is free from any backlinks or ads and has much more functionality.
How to Convert Websites into Desktop and Mobile App In today’s mobile-oriented world every business needs to offer mobile apps for its products and services to gain and retain customers. Even desktop users like native apps more than relying on a website for extensive work. This makes native apps preferred over a website because nobody likes opening and switching tabs. Gantt - Editable JavaScript DHTML Gantt Chart with Rich API dhtmlxGantt is an open source JavaScript Gantt chart that helps you visualize a project schedule in a nice-looking chart. It can show the dependencies between tasks as lines and allows you to set up different relationships between tasks (finish-to-start, start-to-start, end-to-end). dhtmlxGantt provides flexible API and a large number of event handles, which gives you the freedom to customize it for your needs. Basic Gantt Chart Filtering and Zooming
Vitaly Friedman's Notebook: List of nifty tools for drawing diagrams, charts and flow-charts List of nifty tools for drawing diagrams, charts and flow-charts » Aug 18, 11:53 AM Update: The site is experiencing heavy load at the moment, please be patient. Meanwhile, you can digg the article, if you think it could be useful for other users. Tangle: a JavaScript library for reactive documents Tangle is a JavaScript library for creating reactive documents. Your readers can interactively explore possibilities, play with parameters, and see the document update immediately. Tangle is super-simple and easy to learn. This is a simple reactive document. When you eat 3 drag
Create Organizational Charts Online using Org Chart Software Org Chart Software Packed with Features Our org chart specific features like filtering makes it super easy to add/remove fields from your entire org chart in 1 click. This means you can do things like show telephone no to HR department while hiding the contact details to rest of the company in one single click. 10 Best Web Scraping Tools to Extract Online Data Web Scraping tools are specifically developed for extracting information from websites. They are also known as web harvesting tools or web data extraction tools. These tools are useful for anyone trying to collect some form of data from the Internet. Web Scraping is the new data entry technique that don’t require repetitive typing or copy-pasting. These software look for new data manually or automatically, fetching the new or updated data and storing them for your easy access. For example, one may collect info about products and their prices from Amazon using a scraping tool.
humble finance - html5 visualization HumbleFinance is an HTML5 data visualization tool written as a demonstration of interactive graphing in HTML5. It is similar to the Flash tool on The tool itself is written entirely in JavaScript, using the Prototype and Flotr libraries. It can be used to display any two 2-D data sets of real numerical data which share an axis.