
Color Oracle. DataViz Slide Deck. MESI18.dv.perception.activity. DataViz Rockstars. DataVizChecklist May2016. DataViz Perceptual Judgment. DataViz Planning Process. Chocolates - Template for Nuggets. Chocolates - Template for Kisses. Online DataViz Checklist. Computer Science - Landscape Study - The Center for Elementary Mathematics and Science Education. The survey yielded a rich, wide ranging set of findings.

However, when considered together, those findings lead to three main conclusions: As a field, computer science education professional development needs to move toward more coherence. As a field, computer science education professional development needs to move toward better fitting the needs of the groups that will comprise the computer science teacher workforce. As a field, computer science education professional development needs to focus more on teaching and learning in the classroom. This table synthesizes all of the summary tables in this report.
OECD Better Life Index. Mountains Out of Molehills. What do jelly beans have to do with Museum visitors? Remove to Improve Visualizations. Primary Website. Edward Tufte is a statistician and artist, and Professor Emeritus of Political Science, Statistics, and Computer Science at Yale University.

He wrote, designed, and self-published 4 classic books on data visualization. The New York Times described ET as the "Leonardo da Vinci of data," and Business Week as the "Galileo of graphics. " He is now writing a book/film The Thinking Eye and constructing a 234-acre tree farm and sculpture park in northwest Connecticut, which will show his artworks and remain open space in perpetuity.
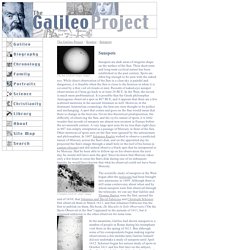
He founded Graphics Press, ET Modern gallery/studio, and Hogpen Hill Farms LLC. Visual Display of Quantitative Information 200 pages Envisioning Information 128 pages Visual Explanations 160 pages Beautiful Evidence 214 pages Same paper and printing as in original clothbound editions. All 4 clothbound books, autographed by author $150 Available directly from Graphics Press. Tufte in His Own Words. Primary Website. Susnpot Drawings. Galileo's Sunspot Drawings In 1612 during the summer months, Galileo made a series of sunspot observations which were published in Istoria e Dimostrazioni Intorno Alle Macchie Solari e Loro Accidenti Rome (History and Demonstrations Concerning Sunspots and their Properties, published 1613).
Because these observations were made at appoximately the same time of day, the motion of the spots across the Sun can easily be seen. To illustrate this, thirty-six of Galileo's sunspot drawings have been placed in sequence as "flip-book" type animation which can be played at two different speeds. The faster animination better demonstates to movement of the sunspots. The slower animation affords the opportunity for more careful study of Galileo's drawings. Animations Several file formats are available for making computer animations--each with its own advantages and disadvantages. MPEG Animations: Smaller file size, but lower quality images. Individual Sunspot Drawings First row (left to right): Primary Website. Primary Website.
Stephanie Evergreen. About John Snow. John Snow is an iconic figure in epidemiology and public health, best known for his work on cholera, for a famous map, and for organising the removal of a pump handle in Soho.

Less well known are his important contributions to anaesthesia and to epidemiological methods, and his engagement in public debates of the time. The breadth and depth of Snow’s activities provide a model for population researchers concerned not only with sound method but also with bringing their results to public benefit. Galileo Project. Sunspots Sunspots are dark areas of irregular shape on the surface of the Sun.
Their short-term and long-term cyclical nature has been established in the past century. Spots are often big enough to be seen with the naked eye. While direct observation of the Sun in a clear sky is painful and dangerous, it is feasible when the Sun is close to the horizon or when it is covered by a thin veil of clouds or mist. Excel Tutorials. Walk through the analytical process one technique at a time.
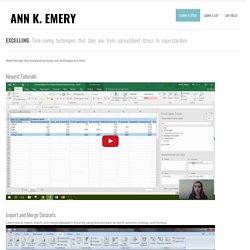
Newest Tutorials Import and Merge Datasets Learn how to import, export, and merge datasets in Excel by using features such as text to columns, vlookup, and hlookup. Organize Your Spreadsheets When you’re staring at a spreadsheet for hours on end, a little organization can go a long way. Juice Labs - Chart Chooser. A Periodic Table of Visualization Methods. Circos Table Viewer - Circular Visualization of Tabular Data. Before uploading a data file, check the samples gallery to make sure that your data format is compatible. Your file must be plain text. Your data values must be non-negative integers. Data must be space-separated (one or more tab or space, which will be collapsed). No two rows or columns may have the same name. Column and row names must begin with a letter (e.g. Need help? If you are using the size, order or color options below, make sure your input file has the appropriate content (see samples 5-9).
Sankeymatic. <svg id="sankey_svg" height="600" width="600" xmlns=" version="1.1"><title>Your Diagram Title</title><!
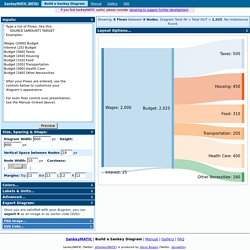
Copy the code above to embed your diagram. Paloma Faith - Do You Want The Truth Or Something Beautiful? Do you want the truth or something beautiful? Using Gestalt Theory in Visualizations and Presentations. XKCD Comic. Useful junk?: the effects of visual embellishment on comprehension and memorability of charts.