10 sites pour créer une infographie. Infographic App & Presentation Tool. How to make an infographic online: five essential free tools. Given the popularity of infographics, you’d be wise to consider using them to help achieve your content marketing goals.
They can be great for social sharing, blog fodder and inbound links. The last time I created an infographic I used – wait for it - Microsoft Excel. Thankfully there are now some far better options, and they're surprisingly easy to use. I have compiled five of online tools that will help you to create infographics. They’re all free, though some require registration (or to connect your Twitter or Facebook account) and most have the upgrade options. Hold on a moment! Before you begin, consider that many infographics are often – to quote Econsultancy Research Director Linus Gregoriadis – “high on graphics and low on information”. As such it is important to map out your story / message / goals before starting to work on the design itself. There’s a great post on the LEWIS PR blog that explains how to optimise an infographic, based around three key questions, which are: 1. 2. 3. Créer des infographies en ligne : outils et bonnes pratiques.
La visualisation des données offre aux professionnels une manière innovante de communiquer des informations.
Éditeurs web et journalistes, services de communication d'entreprise, spécialistes du marketing -et plus généralement les professionnels amenés à faire des présentations publiques- recourent aux infographies pour mettre en valeur l'information, la vulgariser et la contextualiser. Si la création d'infographie est avant tout un métier, elle est aujourd'hui également accessible aux non-initiés. Create Infographics online. 20+ Tools to Create Your Own Infographics. A picture is worth a thousand words – based on this, infographics would carry hundreds of thousands of words, yet if you let a reader choose between a full-length 1000-word article and an infographic that needs a few scroll-downs, they’d probably prefer absorbing information straight from the infographic.
What’s not to like? Colored charts and illustrations deliver connections better than tables and figures and as users spend time looking back and forth the full infographic, they stay on the site longer. Plus, readers who like what they see are more likely to share visual guides more than articles. While not everyone can make infographics from scratch, there are tools available on the Web that will help you create your very own infographics. In this article, we’re listing more than 20 such options to help you get your messages across to your readers, visually. Read Also: The Infographic Revolution: Where Do We Go From Here? What About Me? “What About Me?” Vizualize.me Piktochart easel.ly. Quatre sites pour créer gratuitement des infographies. 46 Tools To Make Infographics In The Classroom. Infographics are interesting–a mash of (hopefully) easily-consumed visuals (so, symbols, shapes, and images) and added relevant character-based data (so, numbers, words, and brief sentences).
The learning application for them is clear, with many academic standards–including the Common Core standards–requiring teachers to use a variety of media forms, charts, and other data for both information reading as well as general fluency. It’s curious they haven’t really “caught on” in schools considering how well they bridge both the old-form textbook habit of cramming tons of information into a small space, while also neatly overlapping with the dynamic and digital world. So if you want to try to make infographics–or better yet have students make them–where do you start? The 46 tools below, curated by Faisal Khan, are a good place to start.
Top 10 Online Tools to Create Infographics. Infographics have become extremely popular online tools to create a compelling visualization.
Imagine the difference in conveying the beauty of Irises by telling someone about them vs showing them the Iris painting by Van Gogh. There is a world of difference in an image and how much information it can pass through to the viewer. Infographics convey a message much more effectively than a stand alone written article or photo. It is easy to absorb the information and much more fun than reading through a written article and much more likely to be shared. Five Free Infographic Templates. Infographics are a powerful tool for capturing the attention of your target audiences.
In fact, businesses that publish infographics grow their traffic an average of 12% more than those that don’t. The hard part, of course, is finding the time and resources to create these infographics. Infographies: 5 outils à découvrir. Récemment, j’ai fait quelques recherches pour trouver un outil me permettant de réaliser facilement une infographie.

Au fil de mes recherches, 5 outils ont retenu mon attention. Cet article vise à vous présenter sommairement chacun de ces 5 outils: Easel.ly, Venngage, Piktochart, Infogr.am, ainsi que 5 "templates" d’infographies élaborées dans PowerPoint. #1 : Easel.ly. Thinglink : l'outil qui dynamise vos pages web (Tuto vidéo) Bonjour !
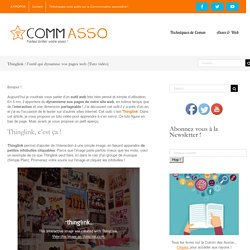
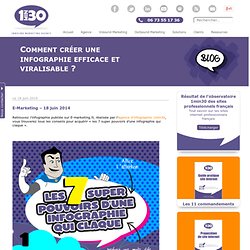
Aujourd’hui je voudrais vous parler d’un outil web très bien pensé et simple d’utilisation. En 5 mn, il apportera du dynamisme aux pages de votre site web, en même temps que de l’interaction et une dimension partageable ! J’ai découvert cet outil il y a près d’un an, et j’ai eu l’occasion de le tester sur d’autres sites internet. Cet outil, c’est Thinglink. Dans cet article, je vous propose un tuto vidéo pour apprendre à s’en servir. Thinglink, c’est ça ! Comment créer une infographie efficace et viralisable. E-Marketing – 18 juin 2014 Retrouvez l’infographie publiée sur E-marketing.fr, réalisée par l’agence d’infographie 1min30, vous trouverez tous les conseils pour acquérir « les 7 super pouvoirs d’une infographie qui claque ».
Partant du principe que la vie est bien trop courte pour être gaspillée en pensums, des entreprises proposent de nouveaux services à leurs clients pour les remplacer dans ces tâches fastidieuses. Untitled design - Canva. Créer une infographie. Graphisme Archives - Page 7 of 18 - Allweb2. Viusal.ly est magique.