
Python. TopoGrabber. What is TopoGrabber?
TopoGrabber is a package designed to simplify the task of obtaining high resolution USGS datasets in formats readable by modelling and analysis software packages. Files are downloaded in GeoTIFF format, then converted to raw tiles for the WRF preprocessing system (WPS), and NetCDF tiles for the Local Analysis and Prediction System (LAPS) and the Space and Time Multiscale Analysis System (STMAS). The LAPS/STMAS interface with Topograbber is still experimental. The tiles produced may need some modifications to the 'gridgen_model.exe' program so they can be read in.
A second way to use this with LAPS is to generate a WPS terrain file, and then read that in during the LAPS/STMAS localization process. Why download high resolution datasets? Although TopoGrabber was created with high-res topography and land use data in mind, it can be used to obtain any available USGS data in any available format. Download TopoGrabber Latest Release Package Components Installing TopoGrabber. Scraping for… by Paul Bradshaw.
Scraping - getting a computer to capture information from online sources - is one of the most powerful techniques for data-savvy journalists who want to get to the story first, or find exclusives that no one else has spotted.

Faster than FOI and more detailed than advanced search techniques, scraping also allows you to grab data that organisations would rather you didn’t have - and put it into a form that allows you to get answers. Scraping for Journalists introduces you to a range of scraping techniques - from very simple scraping techniques which are no more complicated than a spreadsheet formula, to more complex challenges such as scraping databases or hundreds of documents. At every stage you'll see results - but you'll also be building towards more ambitious and powerful tools.
You’ll be scraping within 5 minutes of reading the first chapter - but more importantly you'll be learning key principles and techniques for dealing with scraping problems. Collecting and Scraping data. Maps with R (II) « Omnia sunt Communia! In my my last post I described how to produce a multivariate choropleth map with R.
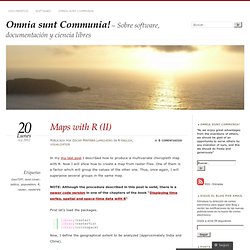
Now I will show how to create a map from raster files. One of them is a factor which will group the values of the other one. Thus, once again, I will superpose several groups in the same map. NOTE: Although the procedure described in this post is valid, there is a newer code version in one of the chapters of the book “Displaying time series, spatial and space-time data with R“ First let’s load the packages. Now, I define the geographical extent to be analyzed (approximately India and China). The first raster file is the population density in our planet, available at this NEO-NASA webpage (choose the Geo-TIFF floating option, ~25Mb). The second raster file is the land cover classification (available at this NEO-NASA webpage) The codes of the classification are described here. EDIT: Following a question from a user of rasterVis I include some lines of code to display this qualitative variable in the map.
Enterprise Data Management.
Cloud Solutions. Data Visualisation. Data Education. Data Analytics. AnalyticBridge - Social Network For Analytic Professionals. AnalyticBridge Group News. Data Analytic Tools.