

Bullhorn Staffing Indicator. Introduction Released weekly, the SIA | Bullhorn Staffing Indicator comprises two sets of analyses; a Year-over-Year comparison showing how the most recent week compares to the same week 12 months previously and an indexed value that has been benchmarked against data from the week ending January 19th, 2019.
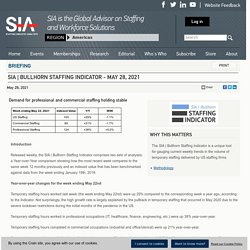
Year-over-year changes for the week ending May 22nd Temporary staffing hours worked last week (the week ending May 22nd) were up 29% compared to the corresponding week a year ago, according to the Indicator. Not surprisingly, the high growth rate is largely explained by the pullback in temporary staffing that occurred in May 2020 due to the severe lockdown restrictions during the initial months of the pandemic in the US. Temporary staffing hours worked in professional occupations (IT, healthcare, finance, engineering, etc.) were up 38% year-over-year. Employment Trends Index™ (ETI) The Conference Board Employment Trends Index™ (ETI) An aggregate of eight labor-market indicators that shows underlying trends in employment conditions.
Data series: 1973 – present. 06 Apr. 2020 Download complete press release The Conference Board Employment Trends Index™ (ETI) Plummeted in March COVID-19 outbreak causes historic decline in the index Download the National Historical Table. The Conference Board Employment Trends Index™ (ETI) plummeted in March, following a decline in February. “The Employment Trends Index plummeted in March, almost entirely due to the historically large increase in initial claims for unemployment,” said Gad Levanon, Head of The Conference Board Labor Markets Institute.
March’s decrease was fueled by negative contributions from seven of the eight components. The Employment Trends Index aggregates eight labor-market indicators, each of which has proven accurate in its own area. People Ticker Labor Index. The Online Labour Index - Provides an Online Gig Economy Equivalent of Conventional Labour Market Statistics. The Online Labour Index (OLI) is the first economic indicator that provides an online gig economy equivalent of conventional labour market statistics.
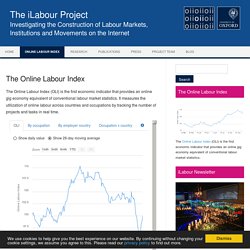
It measures the utilization of online labour across countries and occupations by tracking the number of projects and tasks in real time. ASA Data Dashboard - American Staffing Association. ADP Workforce Vitality Report. Bureau of Labor Statistics Wage Data by Area and Occupation. BLS wage data are available by occupation for the nation, regions, states, and many metropolitan and nonmetropolitan areas.
National Wage Data For over 800 occupations. Data are classified using the Standard Occupational Classification (SOC) System.Data by job characteristics and the level of difficulty and complexity of work.For about 400 industries. Occupational wage data for sector, 3-, 4- and 5-digit North American Industry Classification System (NAICS) industries.Data by occupation and gender Data for men and for women in 200 occupations. Wage Data by State By state. 50 states plus District of Columbia, Guam, Puerto Rico, and Virgin Islands.Data by job characteristics and the level of difficulty and complexity of work. Wage Data by Metropolitan Area For 375 metropolitan statistical areas (MSAs), 34 metropolitan divisions, and over 170 nonmetropolitan areas. Contingent and Alternative Employment Arrangements.
Conference Board-The Burning Glass Help Wanted OnLine (HWOL) Brightfield Indices - Select Resources, then Whitepapers, click on "Extended Workforce Intelligence Report" UK Skills Index - How Skills and Employment Landscape Has Transformed and What Skills are Growing. PayScale Index - National Compensation Trends for The United States. Five of the 32 metro areas included in the PayScale index experienced negative quarter-over-quarter wage growth.
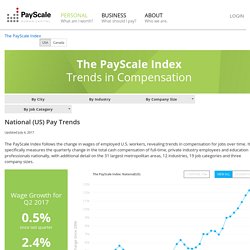
Four were in the Midwest: Detroit (-0.7 percent), Kansas City (-0.3), Minneapolis (-0.1), and Chicago (-0.1). Long-term wage growth is strongest in San Francisco, San Diego, Austin, and Denver. Microsoft Work Trend Index - Measures Productivity in New COVID-19 Work Environment. HRO Today Worker Confidence Index. [Now Including Q4 2020] Historically, there hasn't been a single index to calculate worker confidence within an organization; that is until now.
HRO Today Magazine partnered with and set out on a mission: to develop a proven index to measure U.S. worker confidence and optimism in their job security. After twenty four quarterly surveys, the results demonstrated significant correlations between worker sentiment and other widely used and trusted indices; including Consumer Confidence Index (CCI) and to the GDP.
Complete the form to gain instant access to all of the surveys. Use survey data to better understand how to motivate and retain your employee base. It's time to get to work -- download the survey today! Methodology Yoh and HRO Today Magazine surveyed full-time employees on a monthly basis during Q4 of 2014, and all 4 quarters in 2015, 2016, 2017, 2018, 2019, and 2020. Total Workforce Index - Assess Relative Ease of Sourcing and Retaining Workforce Skills in Competing Global Labor Markets. Hays Global Skills Index - Professional Global Labor market.