
Gabriel
Comunication and politic student
Infografía. Infografía de una computadora personal.
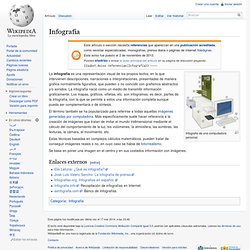
La infografía es una representación visual de los propios textos; en la que intervienen descripciones, narraciones o interpretaciones, presentadas de manera gráfica normalmente figurativa, que pueden o no coincidir con grafismos abstractos y/o sonidos. La infografía nació como un medio de transmitir información gráficamente. Estudios visuales. International Journal of Interactive Multimedia. The Work of Edward Tufte and Graphics Press. Edward Tufte is a statistician and artist, and Professor Emeritus of Political Science, Statistics, and Computer Science at Yale University.

He wrote, designed, and self-published 4 classic books on data visualization. The New York Times described ET as the "Leonardo da Vinci of data," and Business Week as the "Galileo of graphics. " He is now writing a book/film The Thinking Eye and constructing a 234-acre tree farm and sculpture park in northwest Connecticut, which will show his artworks and remain open space in perpetuity. He founded Graphics Press, ET Modern gallery/studio, and Hogpen Hill Farms LLC. Visual Display of Quantitative Information 200 pages. InfoVis.net en Español. Periodismo iconogrfico - Gonzalo Peltzer. La infografía: técnicas, análisis y usos periodísticos - José Luis Valero Sancho. La infografía periodística - Carlos Abreu Sojo. Infographics & Data Visualizations - Visual.ly.
Data. Statistical Data. Mapping & Cartography. Visualizations. Visualisation. All you need to know about Visual Thinking. Visual Thinking. The Anatomy Of An Infographic. Graphic facilitation. DataVisTools. Graphs Infographics. Visualizing Data. Data Visualization, Information Design and Infographics. Infographic of the Day. WWW Visualization & Infographics. Visual Thinking. Network Visualization. The Infographics Showcase - Data Visualization - Infographic Design. 233grados.com: Infografía. La Society for News Design (SND) ha dado a conocer a los ganadores de los premios a los mejores diseños de noticias digitales 2012.

Casi 500 piezas fueron evaluadas por el jurado que ha otorgado 73 Premios a la Excelencia, 2 Medallas de Oro y 8 Medallas de Plata. Lainformacion.com ha sido premiado en 7 categorías, siendo el único medio español galardonado. Data Visualizations, Challenges, Community. A visual exploration on mapping complex networks. Cool Infographics - Blog. Infographicworld.com. A Dumbass’s Guide to the Super Bowl [infographic] January 31, 2014 by infographicworld Don’t know much about football?
We can help. We may not be able to turn you into a loud-mouthed pundit, but here are the basic elements you need to know to watch Sunday’s Super Bowl for something other than the commercials. Search results for infographics. Atlas do habitual. If you had a visualization of every place you've been for 200 days, what could you do with it?
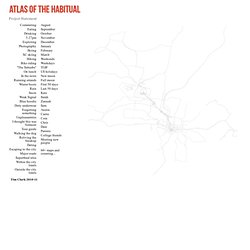
What could it tell you about yourself and how could others use the data? Technology allows us to see information in a way we never could before. Scale of Universe - Interactive Scale of the Universe Tool. Infografias. The Rational Person's Guide to the Mayan Apocalypse by Jaquelynne Avery on Prezi. 12 Great Visualizations That Made History. Most visualizations end up as passing follies that are significant in the short-term, but in the long-run they fade to the background with the rest of the noise.
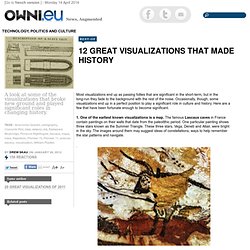
Occasionally, though, some visualizations end up in a perfect position to play a significant role in culture and history. Here are a few that have been fortunate enough to become significant. 1. One of the earliest known visualizations is a map. The famous Lascaux caves in France contain paintings on their walls that date from the paleolithic period. The 22 Best Infographics We Found In 2011. 2011 was a huge year for infographic design. Large companies embraced data renderings as a business strategy like never before, whether it was to promote their brand (GE) or bolster their bottom line (the New York Times). Nowhere was that more evident than at Facebook.
20 Great Visualizations of 2011. As the popularity of visualizations grows, so does their range and quality.
Here’s a list of 20 of the best Static Visualizations, Interactive Visualizations, and Information Videos from 2011. (Note: while they are numbered for your convenience, the entries are not ranked.) Static Visualizations. 20 Examples Of Infographs That You Don’t See Every Day. I think we all know what an infograph is, and nowadays they are increasingly popular.
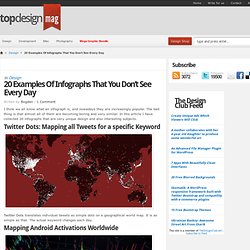
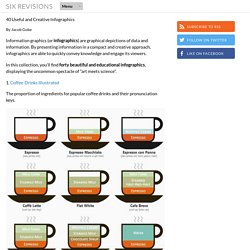
The bad thing is that almost all of them are becoming boring and very similar. In this article I have collected 20 infographs that are very unique design and also interesting subjects. Twitter Dots: Mapping all Tweets for a specific Keyword Twitter Dots translates individual tweets as simple dots on a geographical world map. 25+ Creative Infographics That will make you Look Twice. Infographics, provide a great way to visualize a topic that would be hard to understand when reading. Infographics are present to us in media sources like magazines, television, books, posters, signs, and anything else that has complex information.
Let’s be honest, we tend to get bored with reading too much text and it’s rather difficult to understand descriptive information especially if they signify numbers or statistics. To make things easier, we use graphs, illustrations and flowcharts to make them visually appealing yet, at the same time, easy to understand. 35 Great Social Media Infographics. 40 Useful and Creative Infographics. Six Revisions Menu Main Categories CSS HTML JavaScript.
60 Most Amazing Infographics [Hand-Picked] One Year of Infographics. 20 Great Infographics of 2012. 2012 has certainly been an eventful year, with everything from elections, to olympics, to scientific breakthroughs, to major weather events.

To help review some of the things that happened, here are 20 of the best static infographics from the year. 1. There were several space related events this year. NASA’s Curiosity rover landed on mars, and successfully began collecting data. As this graphic by billowyclouds shows, the scariest part was a terrifying 7 minute landing. 2. 20 Great Motion Graphics of 2012. 10 significant visualisation developments: July to December 2012. To mark the milestone of each mid-year and end of year I try to take a reflective glance over the previous 6 months period in the data visualisation field and compile some of the most significant developments.
These are the main projects, events, new sites, trends, personalities and general observations that have struck me as being important to help further the development of this field. Earlier this year I published this collection for the first 6 months of 2012 and now I’d like to mark the end of 2012 with my latest perspective. I look forward to hearing from you with suggestions for the developments you believe have been most significant. Data Visualisation. Infographs. Infographics. Mind Maps/Thinking Maps/Graphic Organizers. DATA visualisation. Data-visualisation. Visualising Data. Cibercultura. Crisis Communications. Virtual Communities, Social Media & Virtual Worlds. Alternative Media. Aproximaciones al periodismo digital - Antonio García Jiménez. Journalism. News, Politics, Future. Free Ebooks. Tech. Internet, Computers, Mobiles & Engineering. Web 2.0 Apps (+Cloud) Internet, Online & Web.
Firefox. Google. The end of Google Reader. Google+ Google Cloud. Google... Hack/ How To Become A Hacker. Copyright © 2001 Eric S. Hacking. CyberCulture. Think Global. Cyberculture. Science. Scienze sociali. Mind. Personality types. Psychology & neuroscience. Neuroscience. Cinema. Street Art. ART Audio Visual. Street art. 30 examples of the art of mapping personal habits. Tattoo.