
D3.js - Data-Driven Documents. Cola.js: Constraint-based Layout in the Browser. Raphaël—JavaScript Library. Highcharts - Interactive JavaScript charts for your webpage. ZingChart - JavaScript Charting Library - HTML5 Charts. Tangle: a JavaScript library for reactive documents. Tangle is a JavaScript library for creating reactive documents.
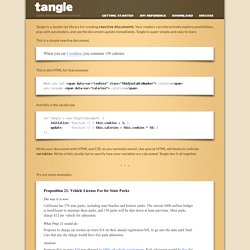
Your readers can interactively explore possibilities, play with parameters, and see the document update immediately. Tangle is super-simple and easy to learn. This is a simple reactive document. When you eat 3 drag cookies, you consume 150 calories. This is the HTML for that example. When you eat <span data-var="cookies" class="TKAdjustableNumber"> cookies</span>, you consume <span data-var="calories"> calories</span>.
And this is the JavaScript. Write your document with HTML and CSS, as you normally would. Try out some examples. Proposition 21: Vehicle License Fee for State Parks The way it is now: California has 278 state parks, including state beaches and historic parks. What Prop 21 would do: Proposes to charge car owners an extra $18 on their annual registration bill, to go into the state park fund.
Analysis: Suppose that an extra $18 was charged to 100 % of California taxpayersvehicle registrations. Fc = 2 KHz Q = 0.8 Unstable. Arbor.js. Cubism.js. Time Series Visualization foo7.6 bar−6.2 foo + bar1.4 foo - bar14 Cubism.js is a D3 plugin for visualizing time series.
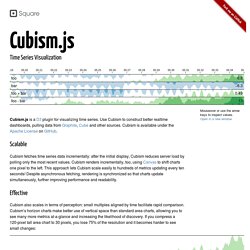
Scalable Cubism fetches time series data incrementally: after the initial display, Cubism reduces server load by polling only the most recent values. Effective Cubism also scales in terms of perception: small multiples aligned by time facilitate rapid comparison. Area (120px)7.6 Area (30px)7.6 In contrast, horizon charts reduce vertical space without losing resolution. Horizon, 1-band (120px)7.6 Horizon, 2-band (60px)7.6 Horizon, 3-band (40px)7.6 Horizon, 4-band (30px)7.6. JavaScript InfoVis Toolkit. Paper.js - Paper.js. Processing.js.
Rickshaw: A JavaScript toolkit for creating interactive time-series graphs. Graphing Toolkit Rickshaw provides the elements you need to create interactive graphs: renderers, legends, hovers, range selectors, etc.
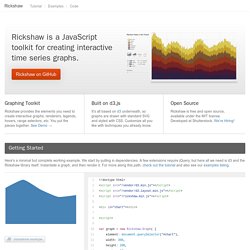
You put the pieces together. See Demo → Built on d3.js It's all based on d3 underneath, so graphs are drawn with standard SVG and styled with CSS. Open Source Rickshaw is free and open source, available under the MIT license. Getting Started Here's a minimal but complete working example. Area Graphs Lines Bars Scatterplot Interactive Legend Add a basic legend: Add functionality to toggle series' visibility on and off: Highlight each series on hover within the legend: Add drag-and-drop functionality to re-order the stack (requires jQueryUI): Interactive Hover Details Show the series value and formatted date and time on hover: Specify formatting callbacks to customize output: See the custom formatter and subclass examples for more.
Annotations Add toggleable annotations: annotator.add(timestamp, message);annotator.update(); Range Slider Graphs & Data via AJAX / JSONP Tutorial. Raphaël—JavaScript Library. Sigma js.