
Open Monitoring Distribution - start.
Page. Automated backup of your switches (hp,cisco,juniper..) configuration with rancid. Rancid & WebSVN Backups more often we forget to do are the network backup, and when a problem arises, we are very annoyed to find our exact configuration.
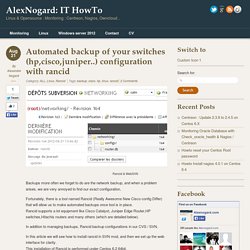
Fortunately, there is a tool named Rancid (Really Awesome New Cisco config Differ) that will allow us to make automated backups once tool is in place. Rancid supports a lot equipment like Cisco Catalyst, Juniper Edge Router,HP switches,Hitachis routers and many others (which are detailed below). In addition to managing backups, Rancid backup configurations in our CVS / SVN. In this article we will see how to install rancid in SVN mod, and then we set up the web interface for clarity. Now to install Rancid: Installation We need to install the prerequisites: # yum -y install expect cvs python httpd mysql mysql-server gcc make autoconf gccc++ kernel-devel mod_python mysql-python# yum -y install php-common php-gd php-mcrypt php-pear php-pecl-memcache phpmhash php-mysql php-xml Then creates the user & group to use our Rancid: # su – rancid $ . Installing and Configuring RANCID on CentOS 6.x.
Geek Speak: How to Configure NetFlow v5 & v... To dig deep into your organization’s network behavior and movement of traffic, you need to better understand NetFlow data in your routers.
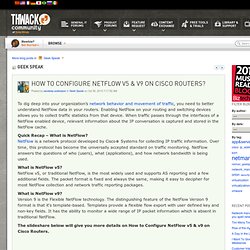
Enabling NetFlow on your routing and switching devices allows you to collect traffic statistics from that device. When traffic passes through the interfaces of a NetFlow enabled device, relevant information about the IP conversation is captured and stored in the NetFlow cache. Quick Recap – What is NetFlow? NetFlow is a network protocol developed by Cisco® Systems for collecting IP traffic information. Over time, this protocol has become the universally accepted standard on traffic monitoring. What is NetFlow v5? NetFlow v5, or traditional NetFlow, is the most widely used and supports AS reporting and a few additional fields. What is NetFlow v9? Version 9 is the Flexible NetFlow technology. The slideshare below will give you more details on How to Configure NetFlow v5 & v9 on Cisco Routers.
Learn More.
Electricité. Nagios Reporting Tool. Monitoring Webinterface. Navigation configuration is split in two files menu.conf menu_local.conf The menu.conf contains the default side menu configuration.

Do not change it as this file will be overwritten with every update. If you want to create a complete custom navigation, just copy this file to menu_local.conf and adjust it to your needs. See the next chapter on how to add just add a few links without having to copy the complete file. The menu_local.conf contains the user configuration for the side menu. The file itself is perl syntax, so you can do whatever perl can do. If you just want to add a few entries, create a empty menu_local.conf and put these lines into it: Using Information About Our Network to Remove Monitoring Noise by Taylor of 37signals.
Our team adds new checks and alerts every week so that we can stay ahead of new issues.

We try very hard to make sure that each alert is configured and tested such that it provides timely and credible evidence of a real problem. Sometimes though, when things go wrong we are inundated with alert information which actually hinders and confuses our problem identification and resolution. A real world example A server with two 10 Gigabit network connections experiences a hardware failure and spontaneously reboots. Our Campfire room is filled with alerts not just for the host being down, but also for the switch (ports) the host is connected to.
We monitor the switch ports because we want to know that they are at the correct speed, that there are no individual failures, and that no “foreign” devices have been plugged into the network. In cases like this we need to make our monitoring system more aware of the dependencies exist between these checks so that we can eliminate the noise. (Via. Monitoring Linux Disk Statistics with Cacti. I firstly want to acknowledge the work of Mark Round and Linux iostat monitoring with Cacti.
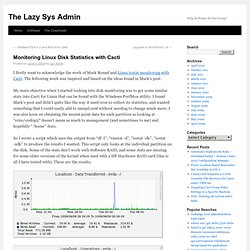
The following work was inspired and based on the ideas found in Mark’s post. My main objective when I started looking into disk monitoring was to get some similar stats into Cacti for Linux that can be found with the Windows PerfMon utility. I found Mark’s post and didn’t quite like the way it used cron to collect its statistics, and wanted something that I could easily add to snmpd.conf without needing to change much more. I was also keen on obtaining the mount point data for each partition as looking at “cciss/c0d0p3″ doesn’t mean as much to management (and sometimes to me) and hopefully “/home” does.
So I wrote a script which uses the output from “df -l”, “vmstat -d”, “iostat -dk”, “iostat -xdk” to produce the results I wanted.