
InspectIT/inspectIT. Installation · stagemonitor/stagemonitor Wiki. Toshisam/nmon-for-splunk. Elastic/topbeat. Bonito/src/bonitosrv/metrics at master · tsg/bonito. Health and Performance Monitoring for Java Applications. 50+ Application Performance Monitoring Tools. Looking for application performance monitoring tools?
We have a huge list of application performance monitoring software that can help you manage your applications. Many of these tools are specialized in web application performance monitoring, however you can also find tools that can monitor other enterprise applications and processes as well. Application performance management is essential part of any business running software. Choosing the right application performance management tool can help you reduce a lot of cost and unwanted burden on support team. Today, with continuous research and development, IT applications can be broadly defined as the key to modern business processes such as management of various office tasks. Take a Walk on the OPS side - PHP Tour 2014. Journée DevOps : Des dashboards pour tous avec ElasticSearch, Logstas… Journée DevOps : Tests de performance en continu. 40 essential Java resources. The most useful coding tools are ones that not only improve our code, but also our productivity.
When it comes to Java there are dozens of useful tools that perform both functions. Whatever task you have at hand, there’s a Java orientated tool to help you out. Today I’ve gathered together a list of my favourites. Java Profiler Java Profiler UI helps you resolve performance bottlenecks, pin down memory leaks and understand threading issues.
Clover Clover provides the metrics of writing code that does stuff and code that tests stuff. JD-GUI is a decompiler. jClarity jClarity offers two products – one is for performance monitoring called Illuminate and second one is census for focused on garbage collection logs and analysis. OSMC 2014: Time to say goodbye to your Nagios setup. g66.png (PNG Image, 1724 × 1158 pixels) - Scaled (59%) Panorama des solutions de monitoring. Surveiller une plateforme web nécessite la mise en place de plusieurs processus et outils.

D’abord, il faut pouvoir en visualiser facilement les logs, mais ça, on vous en a déjà parlé. Ensuite, il faut pouvoir quantifier le comportement des différents composants de la plateforme – briques système, livrables applicatifs – afin de pouvoir mieux comprendre ce système, notamment lorsqu’il ne fonctionne plus. C’est ce qu’on appelle de manière générique le monitoring. Remplacer Graphite par InfluxDB pour les métriques. - Wooster. Même si je reste un afficionado de Graphite, j'ai voulu tester les avancées du projet InfluxDB et commencer à l'envisager comme base de données pour la métrologie.
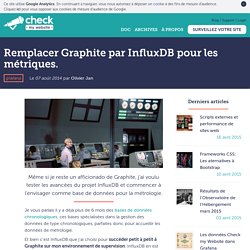
Je vous parlais il y a déjà plus de 6 mois des bases de données chronologiques, ces bases spécialisées dans la gestion des données de type chronologiques, parfaites donc pour accueillir les données de métrologie. Et bien c’est InfluxDB que j’ai choisi pour succéder petit à petit à Graphite sur mon environnement de supervision. Easy JVM CPU profiling with WarmRoast. WarmRoast is a web-based CPU sampler for the Java Virtual Machine with a few select features tailored for diagnosing Minecraft servers and clients.
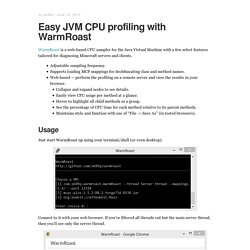
Adjustable sampling frequency.Supports loading MCP mappings for deobfuscating class and method names.Web-based — perform the profiling on a remote server and view the results in your browser. Collapse and expand nodes to see details.Easily view CPU usage per method at a glance.Hover to highlight all child methods as a group.See the percentage of CPU time for each method relative to its parent methods.Maintains style and function with use of “File -> Save As” (in tested browsers). Usage Just start WarmRoast up using your terminal/shell (or even desktop). Connect to it with your web browser. Let’s expand it out to see where most of the tile entities run.
Note: Only a non-modded Bukkit server, you need to look for playerJoinedWorld() and entityJoinedWorld(). Misc: Thread wise CPU monitoring for Java process. A Simple Way to Monitor Java in Linux. Collecting Metrics. In my last blog post ‘Monitoring Riak’ I mentioned that I’d probably write about how to monitor RabbitMQ next.
But that seemed very much like repetition and quite frankly it would probably have been boring. So I thought I’d do a higher level post about collecting metrics in general. Setting the scene At Dataloop.IO we always try to frame our conversations with people around 4 main areas: CollectionRoutingVisualisationAlerting It’s our strategy to become the best in all of those areas. We believe that a good monitoring system pushes collection outside of its core. These metrics need to get streamed to somewhere, and that somewhere needs to scale. At Dataloop.IO we had the luxury of designing everything from the ground up so we created a routing platform internally that scales horizontally and processes metrics as they come in so we can visualise and alert off them in one swoop.
Visualisation and alerting are large subjects on their own. Grafana : monitorer des métriques depuis InfluxDB insérées via collectd (French) - Blog - Vincent Composieux, Développeur PHP Symfony, Golang, Python, NodeJS. L'outil du moment pour monitorer vos métriques et vous sortir de beaux graphiques est Grafana.
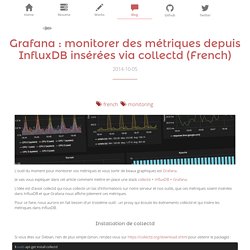
Je vais vous expliquer dans cet article comment mettre en place une stack collectd + InfluxDB + Grafana. Sysdig. Solving Monitoring – Ryan Frantz. February 11, 2015 Narrow Scope I can understand why many folks would make the case that monitoring is terrible, but I think the real issue is one of narrow scope.
Specifically, what we currently define as monitoring is data collection, storage, and threshold-based alerting. These components of the current defintion are generally solved problems, given that we have numerous ways to generate health and performance data, store them, and notify operators when they are outside of expected bounds. Data Collection and Storage One can choose from several well-trodden solutions to capture system- and application-level metrics such as Ganglia, Graphite, and collectd. Speaking of logs, I'd even make the case that log aggregation and indexing solutions like ELK (Elasticsearch, Logstash, Kibana) and Splunk fit into the category of data collection as the information available within log lines can be extremely useful. RealTime Monitor Dashboard with a Time-Series Database: presentation. - Google Slides.