
Graphite - Scalable Realtime Graphing - Graphite. Getting Started. Getting Started will guide you through the process of adding Metrics to an existing application.

We’ll go through the various measuring instruments that Metrics provides, how to use them, and when they’ll come in handy. Setting Up Maven Just add the metrics-core library as a dependency: <dependencies><dependency><groupId>com.codahale.metrics</groupId><artifactId>metrics-core</artifactId><version>${metrics.version}</version></dependency></dependencies> Note Make sure you have a metrics.version property declared in your POM with the current version, which is 3.0.1. Now it’s time to add some metrics to your application!
The Registry The centerpiece of Metrics is the MetricRegistry class, which is the container for all your application’s metrics. Final MetricRegistry metrics = new MetricRegistry(); You’ll probably want to integrate this into your application’s lifecycle (maybe using your dependency injection framework), but static field is fine. Gauges Counters Meters Histograms Timers Health Checks Tip. Download Free Java Performance Tool. Monitoring Made Easy. Hello and welcome to Java-monitor, Java-monitor is the free, on-line monitoring service for Tomcat, Glassfish, JBoss, Jetty and Openfire.
We send you an e-mail when you server goes off-line. You can see trends in your JVM memory use, its garbage collectors, your UNIX file descriptors, JVM threads, database connections, Hibernate statistics and much more. From here you can do two things: if you are not sure what Java-monitor is, you can read the information below and look at the live demo to see Java-monitor in action. Once you are confident that Java-monitor is a useful tool, sign up and install Java-monitor on your servers to enjoy the benefits of this free service. Also, be sure to check out the forum and join in the discussion about for example recognizing memory leaks, using Findbugs to find bugs in third-party libraries and resolve strange garbage collector behaviour.
Kees Jan Koster -- founder of Java-monitor. Javamelody - monitoring of JavaEE applications. The goal of JavaMelody is to monitor Java or Java EE application servers in QA and production environments.
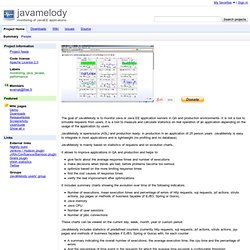
It is not a tool to simulate requests from users, it is a tool to measure and calculate statistics on real operation of an application depending on the usage of the application by users. JavaMelody is opensource (ASL) and production ready: in production in an application of 25 person years. JavaMelody is easy to integrate in most applications and is lightweight (no profiling and no database). JavaMelody is mainly based on statistics of requests and on evolution charts. It allows to improve applications in QA and production and helps to: give facts about the average response times and number of executions make decisions when trends are bad, before problems become too serious optimize based on the more limiting response times find the root causes of response times verify the real improvement after optimizations There is a public Demo The JIRA/Confluence/Bamboo plugin is available here.
Tired of Nagios and Cacti? Try Zabbix. An Enterprise-Class Open Source Distributed Monitoring Solution.