
NST Network Interface Bandwidth Monitor 2 - NST Wiki. A use case for the Bandwidth Monitor can be found in the Wiki article: "LAN Ethernet Maximum Rates, Generation, Capturing & Monitoring".
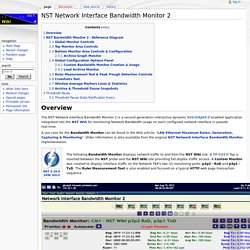
Older information is also available from the original NST Network Interface Bandwidth Monitor implementation. The following Bandwidth Monitor displays network traffic to and from the NST Wiki site. A TP-CU3 Tap is inserted between the NST probe and the NST Wiki site providing full-duplex traffic access. A Custom Monitor was created to display interface traffic on the Network TAP's two (2) monitoring ports: p3p2 - RxD and p3p1 - TxD.
Gringonet.com - DNS Whois IP. README. Www.eLuna.org: eLuna Graph System. eLuna Graph System is an application written in Perl based on RRDTool and distributed under GNU General Public License.

RRDtool - RRDtool Gallery. MMS Inbound Simply parse of SNMPget from Vendor OID.
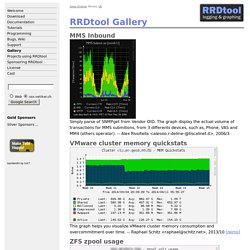
The graph display the actual volume of transactions for MMS submitions, from 3 differents devices, such as, Phone, VAS and MM4 (others operator). -- Alex Rivoltella <alessio.r-delme-@XYZ-tiscalinet.it>, 2006/3 VMware cluster memory quickstats. Bandwidth Monitoring Tools For Linux. Bandwidth in computer networking refers to the data rate supported by a network connection or interface.
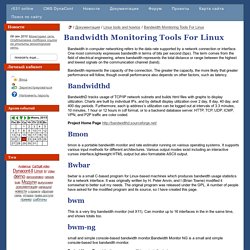
One most commonly expresses bandwidth in terms of bits per second (bps). The term comes from the field of electrical engineering, where bandwidth represents the total distance or range between the highest and lowest signals on the communication channel (band). Bandwidth represents the capacity of the connection. The greater the capacity, the more likely that greater performance will follow, though overall performance also depends on other factors, such as latency. Bandwidthd BandwidthD tracks usage of TCP/IP network subnets and builds html files with graphs to display utilization. The Enterprise-Class Open Source Network Monitoring Solution. Zabbix is used by many companies, from very small with just few devices, and up to very large ones with tens of thousands of devices under control.
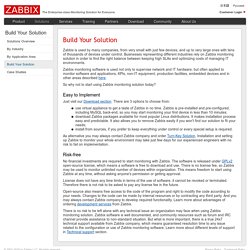
Businesses representing different industries rely on Zabbix monitoring solution in order to find the right balance between keeping high SLAs and optimizing costs of managing IT environments. Zabbix monitoring software is used not only to supervise network and IT hardware, but often applied to monitor software and applications, KPIs, non-IT equipment, production facilities, embedded devices and in other areas described here. So why not to start using Zabbix monitoring solution today? Easy to Implement Just visit our Download section. Start page – collectd – The system statistics collection daemon. Moodss and moomps. How To Install Puppet To Manage Your Server Infrastructure. Note: A newer version of this tutorial, which uses Puppet Server instead of Puppet with Passenger, can be found here: How To Install Puppet 4 in a Master-Agent Setup on Ubuntu 14.04.
Introduction Puppet, from Puppet Labs, is a configuration management tool that helps system administrators automate the provisioning, configuration, and management of a server infrastructure. Planning ahead and using config management tools like Puppet can cut down on time spent repeating basic tasks, and help ensure that your configurations are consistent and accurate across your infrastructure. Once you get the hang of managing your servers with Puppet and other automation tools, you will free up time which can be spent improving other aspects of your overall setup. Puppet comes in two varieties, Puppet Enterprise and open source Puppet. In this tutorial, we will cover how to install open source Puppet in an Agent/Master setup. Prerequisites Example Infrastructure Create Puppet Master Server Install NTP. Untitled. Available Now: Free Server Monitoring as a core feature of New Relic app management - New Relic blog.
When enough customer conversations include the phrase “You know, you ought to add server metrics to New Relic,” you get the hint.
So we started to seriously consider what it would take. And the more we thought about it, the more we realized that there were no server monitoring tools that captured and presented server performance data from the perspective of web app performance–as part of a single, comprehensive APM tool, fully integrated and built from the ground up. That was our approach–make a tool that developers and app deployment teams could use to quickly and confidently determine the impact of server health on web application performance. Untitled. Untitled. Back in May we introduced Real User Monitoring, which expanded visibility upwards to measure performance in the user’s browser.
With the addition of Server Monitoring, we are expanding to look beyond the application itself and into the environment that it runs in. The Goal Application developers and Ops teams already use many different tools for monitoring their servers. But too many of these try to simply report every available piece of information to the user. We take a different approach: our job at New Relic goes above simply providing information. Is my application (or server) performing well?
We want to give the user the data that they need to answer these questions in a variety of scenarios, but we need to be just as careful about what we don’t show. The Four Key Metrics When a user is trying to answer the first question, they need to quickly determine the status of many servers at once. For an application, the key metrics are response time, throughput, and error rate.
Newrelic. iOpus Status Dashboard. Bandwidth Monitoring Tools For Linux. Moodss and moomps.