
How to monitor NGINX. This post is part 1 of a 3-part series on NGINX monitoring.
Part 2 is about collecting NGINX metrics, and Part 3 details how to monitor NGINX with Datadog. What is NGINX? NGINX (pronounced “engine X”) is a popular HTTP server and reverse proxy server. As an HTTP server, NGINX serves static content very efficiently and reliably, using relatively little memory. As a reverse proxy, it can be used as a single, controlled point of access for multiple back-end servers or for additional applications such as caching and load balancing. NGINX can also be used as a mail proxy and a generic TCP proxy, but this article does not directly address NGINX monitoring for these use cases. Key NGINX metrics By monitoring NGINX you can catch two categories of issues: resource issues within NGINX itself, and also problems developing elsewhere in your web infrastructure. More generally, there are at least three key categories of metrics to watch: Basic activity metricsError metricsPerformance metrics Active state.
Windows. Critical Capabilities for Security Information and Event Management. Analyst(s): Kelly M.
Kavanagh, Mark Nicolett, Oliver Rochford Critical Capabilities Use Case Graphics Figure 1. Vendors' Product Scores for Compliance Use Case Source: Gartner (June 2014) Figure 2. Figure 3. The weighted capabilities scores for all use cases are displayed as components of the overall score. Vendors AccelOps AccelOps primarily provides SIEM capabilities to the security organization and secondarily provides performance/availability monitoring (PAM) to IT operations.
Real-time monitoring: The AccelOps correlation rule language provides a unified framework for detecting patterns across security, performance, availability, compliance and change management scenarios. Threat intelligence: AccelOps can ingest a variety of external threat data feeds, and can evaluate DNS look-ups and outbound flows to known malicious IP address ranges. Behavior profiling: AccelOps provides statistical analysis that can be used to identify anomalies and deviations from normal behavior. AlienVault NetIQ. 5 Use Cases Enabled by Docker 1.8’s Fluentd Logging Driver. Docker 1.8 Is Here with Fluentd Docker 1.8 is coming out August 8th.
One of the major items in the 1.8 releases is its support for Fluentd as a Logging Driver. As the inventor of Fluentd, we are really excited about this progress. To quote Simon Hørup Eskildsen’s recent blog “Why Docker is Not Yet Succeeding Widely in Production”: One example of an area that could’ve profited from change earlier is logging. Therefore, we were stoked when Docker’s Fluentd Logging Driver landed. In this blog post, we want to take a step back and summarize what use cases this new Fluentd + Docker integration enables. Use Case 1: Archiving Logs into Amazon S3 Using Fluentd’s S3 output plugin, the user can archive all container logs. You never know when these logs are going to be useful, so start archiving them today. Use Case 2: Making Logs Searchable with Elasticsearch Using FLuentd’s Elasticsearch output plugin, all your Docker logs become searchable. Use Case 3: Streaming Logs into Data Processing Backends. AWStats - Free log file analyzer for advanced statistics (GNU GPL).
Open Source Network Discovery Tools. MonitoringScape. The past decade has seen a dramatic shift in how we build applications: clouds, containers and micro-services have displaced the old paradigm of static, monolithic infrastructure.
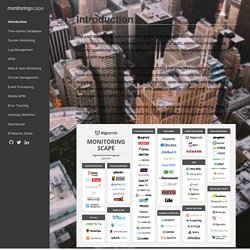
The need for operational visibility has grown tenfold. Thankfully, the monitoring landscape has kept up with the times. We now have a choice of over 100 monitoring tools that provide excellent visibility to every nook and cranny of our IT stack. The modern monitoring landscape has something for everyone: on-prem installations, SaaS applications, open-source tools and high-priced enterprise monitoring suites. However, with so many tools to choose from, the monitoring landscape can be difficult to navigate. MonitoringScape is your guide to the new, exciting world of modern monitoring. Download full resolution version (8MB)
Building self-service tools to monitor high-volume time-series data. One of the main sources of real-time data processing tools is IT operations.

In fact, a previous post I wrote on the re-emergence of real-time, was to a large extent prompted by my discussions with engineers and entrepreneurs building monitoring tools for IT operations. In many ways, data centers are perfect laboratories in that they are controlled environments managed by teams willing to instrument devices and software, and monitor fine-grain metrics.
During a recent episode of the O’Reilly Data Show Podcast, I caught up with Phil Liu, co-founder and CTO of SignalFx, a SF Bay Area startup focused on building self-service monitoring tools for time series. We discussed hiring and building teams in the age of cloud computing, building tools for monitoring large numbers of time series, and lessons he’s learned from managing teams at leading technology companies.