
France d'outre-mer: cartes géographiques gratuites, cartes géographiques muettes gratuites, cartes vierges gratuites, fonds de cartes gratuits, formats graphiques courants. Untitled. Cartographie. Schémas. Antiweather. Antipodes Map - Tunnel to the other side of the world. Folding paper globes - MapScaping. Whether you are looking for a fun family project, a teaching resource or just want something interesting and unique to decorate your home or office with these printable globes are just the thing. The graphic on each globe is not just a pretty picture, made from real topographic data, each globe is a great way of exploring our earth. The globes are designed to be printed in A3 but A4 is fine too. But generally the bigger they are the easier they are to fold!
Especially with the more complicated designs. Each fold line is marked by a thin black line. Map Projection Transitions. Worldmapgenerator + HOME. World’s Most Dangerous Countries Revealed, And It May Change Your Travel Plans. Just like last year, International SOS and Control Risks have released a map that shows just how tourist-friendly all countries are, and it’s worth looking at if you’re planning a trip for 2018 to a place you’ve never been before.
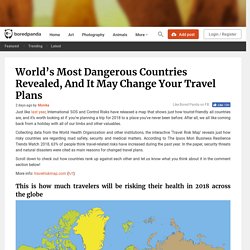
After all, we all like coming back from a holiday with all of our limbs and other valuables. Show Full Text Collecting data from the World Health Organization and other institutions, the interactive ‘Travel Risk Map’ reveals just how risky countries are regarding road safety, security and medical matters. According to The Ipsos Mori Business Resilience Trends Watch 2018, 63% of people think travel-related risks have increased during the past year.
In the paper, security threats and natural disasters were cited as main reasons for changed travel plans. Scroll down to check out how countries rank up against each other and let us know what you think about it in the comment section below! More info: travelriskmap.com (h/t) Finally, the number of road accidents. AuthaGraph オーサグラフ 世界地図. AuthaGraph World Map Antarctica was found in 1820 and the first man reaches the North Pole in 1909.
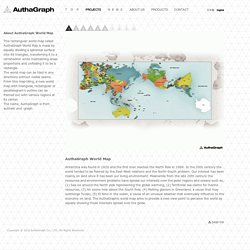
In the 20th century the world tended to be framed by the East-West relations and the North-South problem. Our interest has been mainly on land since it has been our living environment. Meanwhile from the late 20th century the resources and environment problems have spread our interests over the polar regions and oceans such as, (1) Sea ice around the North pole representing the global warming, (2) Territorial sea claims for marine resources, (3) An ozone hole above the South Pole, (4) Melting glaciers in Greenland, a cause that may submerge Tuvalu, (5) El Nino in the ocean, a cause of an unusual weather that eventually influence to the economy on land.
À quoi le monde ressemble vraiment ? La Terre, c'est le monde à l'envers ? A Spy, a Map, and the Quest for Power in 16th-Century Europe. This story appears in the March/April 2017 issue of National Geographic History magazine.
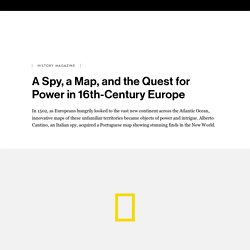
Knowledge is power—and no knowledge was more assiduously coveted by European nations in the early 16th century than the information recorded on nautical maps. Coastlines, harbors, rivers, resources: Details about these features could give a nation a distinct advantage in trying to stake a claim to new lands. The “Cantino Planisphere,” completed in 1502, is the second known chart to have depicted the New World. It included unpublished information on Portuguese trade routes and the ongoing discovery of the coastline of modern-day Brazil. At a time when knowledge of new territories lent expanding nations great strategic and commercial superiority, such maps were guarded as state secrets. Comprising six pieces of parchment attached to a large canvas measuring about four by eight feet, the “Cantino Planisphere” was created in Lisbon.
Putting It Together Wealth of Information. Untitled. De l'Antiquité à Google Maps, la cartographie miroir du pouvoir. Inventée par les Grecs à l'Antiquité, la cartographie a subi au fil du temps nombre d'évolutions : passant d'une approche scientifique à une conception religieuse, pour finir par être définie comme une science quasi-exacte. Au delà du progrès technique et scientifique qu'elle incarne, la cartographie est aussi et surtout un outil de domination politique et militaire essentiel aux jeux de pouvoir plus que d'actualité aujourd'hui.
A lire : Comment Google dessine sa carte du monde La connaissance dans ce domaine s'est particulièrement illustrée au fil de quatre siècles, du globe de Benhaim, en 1492, à celui de Kiepert, en 1879, comme le montre cette vidéo réalisée par la BnF : Les Grecs inventeurs de la cartographie scientifique Trois hommes vont lancer cette nouvelle discipline grâce à leurs travaux précurseurs. Les Romains ne disposant pas des connaissances cartographiques de leurs voisins grecs font appel à ces savants pour établir une image de l'Empire romain. L'imaginaire du Moyen Âge. Remonter le temps.