

Metrics for News. General questions What is Metrics for News?
Metrics for News is an analytics tool that aligns journalism metrics with your editorial values and business model. Its dashboards pull data from your current analytics services and social media platforms into one place, identifying patterns that show how to better engage, monetize and serve audiences with your journalism. Untitled.
The year we talk about our awful metrics. Given the twists and turns journalism faced in 2016, it would be easy enough to conjure up some pessimistic — or even dystopian — views of what lies ahead for the industry.
But I like to think of myself as a realistic and pragmatic optimist, if nothing else because the best way to ensure things won’t improve is to consider it futile to try. So, my primary hopeful prediction for our industry for 2017: Getting serious about better forms of measurement. The industry is running on metrics that serve no one well, but we continue chugging along because we all equally accept the lie. Thus, audiences too frequently get served with unmemorable stories thin on nuance, heavy on provoking knee-jerk response, and with misleading packaging that causes them to bail two sentences, or fifteen seconds, into the piece (assuming the company doesn’t actively measure and talk about bounce rates, completion rates, and/or time spent on site). Considering ways to extend the shelf life of stories.
S metric that matters: Total Time Reading – Data Lab – Medium. The Only Metric That Matters Let’s first take a step back.

Why have a number at all? And if you accept that numbers are a good way by which to measure the success of a business, why have only one? Away from internet-based companies, most businesses measure their success in dollars. But the media industry has always been a little different. When the web took hold (and e-commerce was just a glint in its eye), only events — like page views and, later, clicks—could be measured. “Big data” has brought with it the luxury of being able to measure any (and every) interaction that a user has with an application. Getting started with Carebot – Carebot – Meaningful analytics for journalism. You’ve looked into your newsrooms needs, identified a scope, captured objectives, and brainstormed what measures can help you address them.
You are ready to jump in. How it works Carebot is made up of two parts: an event tracker and a notifications component. The tracker is added to the pages on your site and captures specific events (like the user scrolling down a page), which are sent to Google Analytics. Mouseflow - Session Replay, Heatmaps, Funnels & Forms. L'analytics au service de vos contenus ? The Slack app Carebot is a prototype that seeks to help change how we think about analytics.
If you work at a digital news organization, you’re likely surrounded by numbers: pageviews, shares, clicks.
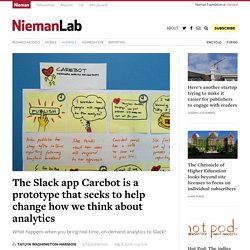
But how do you move past one-size-fits-all stats (and analytics programs designed more for brands and retailers than journalists) to the numbers you should really care about? Carebot is a chatbot that wants to help answer that question by letting publishers define their own windows on analytics data, customized to their own needs. Launched in February by NPR’s visual editor Brian Boyer, former Knight-Mozilla Fellow Livia Labate, and LocalData’s Matt Hampel, Carebot’s mission is to provide meaningful journalism analytics that go beyond pageviews, that allow newsrooms to define success on their own terms. The next step: Moving from generic analytics to editorial analytics. Big screens with real-time traffic data have become ubiquitous in newsrooms.
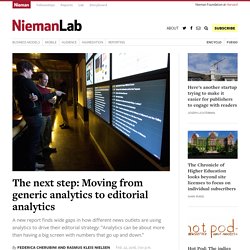
They illustrate how news organizations are becoming more and more interested in tracking audience behavior, as data-informed approaches to decision making previously associated with popular sites like BuzzFeed, Gawker, and The Huffington Post are increasingly central to editorial decision making at upmarket brands like The Guardian, The Wall Street Journal, and Quartz. How newsrooms use analytics, however varies significantly.
Some organizations are very good at making sense of numbers. But most are still only beginning to scratch the surface of what analytics can do for newsrooms. For a new Reuters Institute Report, we have interviewed more than 30 people working across digital startups, newspapers, and broadcasters — people with job titles that were unknown a few years ago, like audience editor, growth editor, audience development editor, or audience engagement editor. Comment faire pour trouver mes KPI ? « Les indicateurs clés de performance (ICP), ou plus généralement appelés KPI (anglais : Key Performance Indicator), sont des indicateurs mesurables d’aide décisionnelle. » (source Wikipedia)
Analyse des statistiques dans une logique de stratégie de contenu. Vos rapports Google Analytics arrivent chaque semaine dans les boîtes aux lettres et c’est génial : au moins, vous en avez paramétrés.
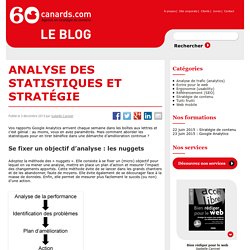
Mais comment aborder les statistiques pour en tirer bénéfice dans une démarche d’amélioration continue ? 5 étapes pour sélectionner des KPI réellement performants. 5 secrets pour choisir un bon KPI. 5 étapes pour sélectionner des KPI réellement performants. Contenu – KPIs pour les responsables seniors. Les indicateurs que je recommande à l’attention des responsables seniors qui gèrent des sites de contenu dont le chiffre d’affaires provient de modèles à base de CPM ou de sponsors sont les suivants: la moyenne des pages vues par visite, le coût moyen par visite, le CPM moyen et le pourcentage de fréquence de visites (haut/moyen/bas).

Moyenne des pages vues par visite La mesure la plus directe du succès d’un site de contenu réside dans les pages vues; au fur et à mesure que vos visiteurs s’intéressent avec le contenu que vous leur fournissez, ils continuent à cliquer et donc à générer davantage de pages vues. A l’inverse, les visiteurs qui se désintéressent de votre contenu finissent par ne plus cliquer ou revenir à la page précédente et quittent votre site.
Vos responsables seniors devraient surveiller la moyenne des pages vues par visite et faire en sorte toute votre entreprise travaille à faire augmenter cette moyenne. ColorZilla Updated.