
Creating Olympic Medal Treemap Visualisations Using OTS R Libraries. In London Olympics 2012 Medal Tables At A Glance?
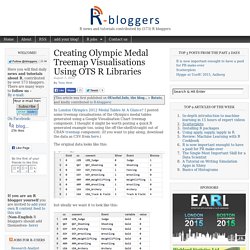
I posted some treemap visualisations of the Olympics medal tables generated using a Google Visualisation Chart treemap component. I thought it might be worth posting a quick R generated example too, using the off-the-shelf/straight out of CRAN treemap component. (If you want to play along, download the data as CSV from here.) The original data looks like this: but ideally we want it to look like this: I posted a quick recipe showing how to do this sort of reshaping in Google Refine, but in R it’s even easier – just melt the Gold, Silver and Bronze columns into a pair of columns… Here’s the full code to do the reshaping and generate a simple treemap: And here’s the treemap: Generating variant views (I described six variants in the original post) is easy enough – just tweak the order of the elements of the index setting.
Out of the can – simples enough… So what might we be able to do with a little bit more treatment? Related Sochi Olympic Medals. An Easy Way to Make a Treemap. Back in 1990, Ben Shneiderman, of the University of Maryland, wanted to visualize what was going on in his always-full hard drive.
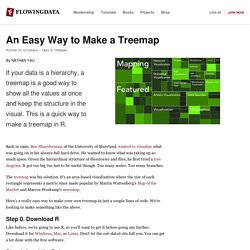
He wanted to know what was taking up so much space. Given the hierarchical structure of directories and files, he first tried a tree diagram. It got too big too fast to be useful though. Too many nodes. Too many branches. Treemap Add-In For Excel – Treemap Software Demo. Treemaps are an interesting way to look at data.
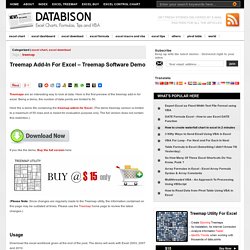
Here is the first preview of the treemap add-in for excel. Being a demo, the number of data points are limited to 50. Here the a demo file containing the treemap add-in for Excel. (The demo treemap version is limited to a maximum of 50 rows and is meant for evaluation purpose only. The full version does not contain this restriction.) If you like the demo, Buy the full version here. (Please Note: Since changes are regularly made to the Treemap utility, the information contained on this page may be outdated at times. Usage. Tree Map. Learn R quick and diRty 19 - Visualization - Tree-mapping. Ordered Treemap Layouts. Abstract Treemaps, a space-filling method of visualizing large hierarchical data sets, are receiving increasing attention.
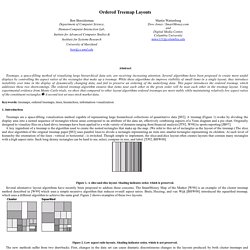
Several algorithms have been proposed to create more useful displays by controlling the aspect ratios of the rectangles that make up a treemap. Inspiration: Word Trees, Maps and the Perfect March Madness Bracket. At Visual.ly, we are constantly coming across amazing data visualizations: from mind-blowing interactive infographics and visualization tools to static designs or videos that leave a lasting impression.
The work of others inspires us to work harder ourselves at creating visualizations and visualization tools — or at the very least gives us a fun topic of conversation or tool to play with. We’d love to share with you some of our findings each week. Visualization: Treemap - Google Charts. Overview A visual representation of a data tree, where each node can have zero or more children, and one parent (except for the root, which has no parents).
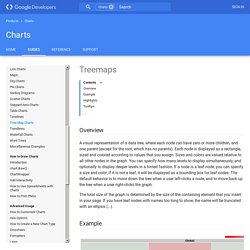
Each node is displayed as a rectangle, sized and colored according to values that you assign. Sizes and colors are valued relative to all other nodes in the graph. You can specify how many levels to display simultaneously, and optionally to display deeper levels in a hinted fashion. If a node is a leaf node, you can specify a size and color; if it is not a leaf, it will be displayed as a bounding box for leaf nodes. The total size of the graph is determined by the size of the containing element that you insert in your page.
Example tree = new google.visualization.TreeMap(document.getElementById('chart_div')); } </script> </head> <body> <div id="chart_div" style="width: 900px; height: 500px;"></div> </body></html> Highlights Tooltips By default, treemap tooltips are basic, showing the label of the treemap cell. Loading Data Format Methods. C++/Tree Mapping Getting Started Guide.