Amplitude, Period, Phase Shift and Frequency
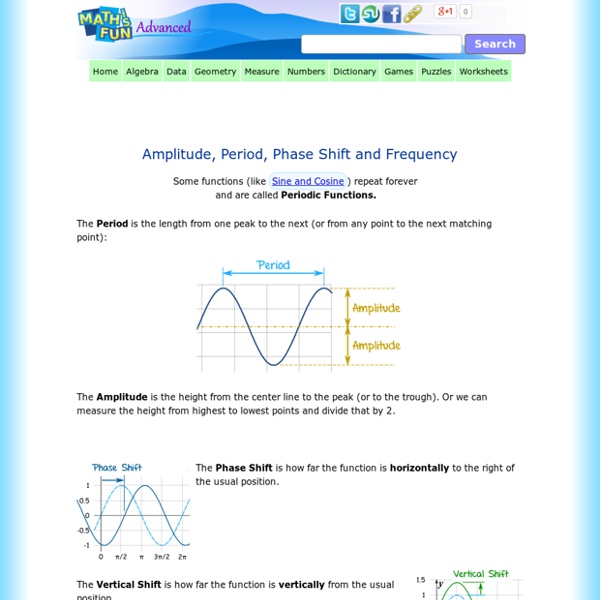
http://www.mathsisfun.com/algebra/amplitude-period-frequency-phase-shift.html
Algebra - Symmetry
Example 1 Determine the symmetry of each of the following equations. (a) [Solution] (b) (c)
Solving Trigonometric Equations
Solving Trigonometric Equations (page 1 of 2) Solving trig equations use both the reference angles you've memorized and a lot of the algebra you've learned. Be prepared to need to think!
A-level Maths Trigonometry Revision - Graphs of trigonometric functions
The graphs of the three major functions are very important and you need to learn the characteristics of each. The sine function This graph is continuous (there are no breaks). The range is -1 ≤ sin θ ≤ +1.
Graphs of trigonometric functions
The Topics | Home Zeros of a function The graph of y = sin x The period of a function The graph of y = cos x The graph of y = sin ax
The Graphs of Sine and Cosine
A sine wave, or sinusoid, is the graph of the sine function in trigonometry. A sinusoid is the name given to any curve that can be written in the form (A and B are positive). Sinusoids are considered to be the general form of the sine function.
Symmetry and Graphing
Symmetry and Graphing (page 3 of 3) Sections: Symmetry about an axis, Symmetry about a point, Symmetry and graphing Symmetry is more of a geometrical than an algebraic concept, but the subject of symmetry does come up in a couple of algebraic contexts.
Trigonometric Equations
Remember to first solve for the trig function and then solve for the angle value. Solution: If there is more than one trig function in the equation, identities are needed to reduce the equation to a single function for solving.
Graphing Trigonometric Functions
Graphing Trigonometric Functions (page 1 of 3) Sections: Introduction, Examples with amplitude and vertical shift, Example with phase shift You've already learned the basic trig graphs. But just as you could make the basic quadratic x2, more complicated, such as –(x + 5)2 – 3, so also trig graphs can be made more complicated. We can transform and translate trig functions, just like you transformed and translated other functions in algebra. Let's start with the basic sine function, f(t) = sin(t).
Amplitude and Period
Amplitude and Period Learning Objective(s) · Understand amplitude and period. · Graph the sine function with changes in amplitude and period. · Graph the cosine function with changes in amplitude and period. · Match a sine or cosine function to its graph and vice versa.
Related:
