
Haptic-Data.com - Computational Design of Kyle Phillips. Nestorsilk/ThreeNodes4Max.js. Schteppe/cannon.js @ GitHub. SceneJS - WebGL Scene Graph Library. Evanw/csg.js. Caat by hyperandroid. Canvas Advanced Animation Toolkit CAAT is an scene graph director-based animation framework for javascript.
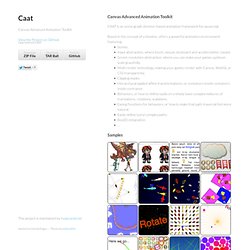
Based in the concept of a timeline, offers a powerful animation environment featuring: Scenes. Input abstraction, where touch, mouse, keyboard and accelerometer coexist. Screen resolution abstraction, where you can make your games up/down scale gracefully. Multi render technology, making your games render with Canvas, WebGL or CSS transparently. Samples Featured Games Tutorials Tutorials JSDoc API API documentation.
Shifty! Shifty is a JavaScript tweening engine designed to fit any number of tweening needs.
Its features include: Speed: Shifty is optimized for performance. Playback control (play/pause/stop) Extensibility: Shifty's Tweenable object works well as the base in a prototype chain. Small download size: The standard distribution (which includes all extensions) is less than 2Kb when minified and gzipped. Fantastic Micro-Frameworks and Micro-Libraries for Fun and Profit! I need ...
Rekapi - A keyframe animation library for JavaScript. Hapticdata/toxiclibsjs. Toxiclibs. Toxiclibs.js - Open-Source Library for Computational Design. There are several areas where toxiclibs.js stands apart to remain more idiomatic and helpful in the javascript environment.
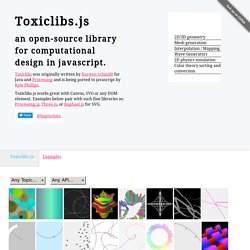
For a complete description of the conveniences added to toxiclibs.js, read the sugar file in the repository. Some examples of these differences are: Sketch.js - Simple Canvas-based Drawing for jQuery. Sketch.js has been tested on Chrome (OS X), Firefox (OS X), Safari (OS X), Android Browser (Honeycomb 3.1).
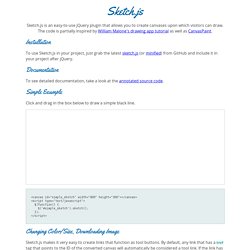
It suffers significant performance degradation on mobile browsers due to general HTML5 Canvas performance issues. Copyright (C) 2011 by Michael Bleigh and Intridea, Inc. Permission is hereby granted, free of charge, to any person obtaining a copy of this software and associated documentation files (the "Software"), to deal in the Software without restriction, including without limitation the rights to use, copy, modify, merge, publish, distribute, sublicense, and/or sell copies of the Software, and to permit persons to whom the Software is furnished to do so, subject to the following conditions: The above copyright notice and this permission notice shall be included in all copies or substantial portions of the Software. SeuratJS - A Raphaël plugin for creating beautiful pointillized animations.
Sole/tween.js. Glfx.js. WebGL Filter. Polymaps. Protovis. Protovis composes custom views of data with simple marks such as bars and dots.
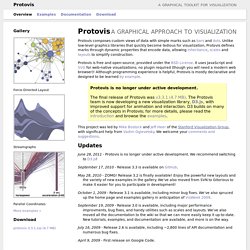
Unlike low-level graphics libraries that quickly become tedious for visualization, Protovis defines marks through dynamic properties that encode data, allowing inheritance, scales and layouts to simplify construction. Protovis is free and open-source, provided under the BSD License. It uses JavaScript and SVG for web-native visualizations; no plugin required (though you will need a modern web browser)! Epicyclic Gearing. Colony. Colony is a neat little visualisation tool for exploring Node projects and their dependencies using d3.js.
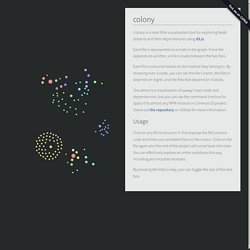
Each file is represented as a node in the graph. If one file depends on another, a link is made between the two files. Each file is coloured based on the module they belong to. By hovering over a node, you can see the file's name, the files it depends on (light), and the files that depend on it (dark). This demo is a visualisation of colony's own code and dependencies, but you can use the command-line tool to apply it to almost any NPM module or CommonJS project.
Click on any file to focus on it: this displays the file's source code and hides any unrelated files on the screen. By pressing the tilde (~) key, you can toggle the size of this text box. D3.js - Data-Driven Documents. Cubism.js. Time Series Visualization.
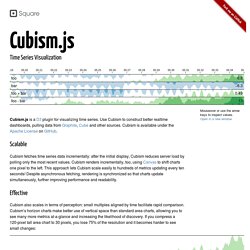
Rickshaw: A JavaScript toolkit for creating interactive time-series graphs. Graphing Toolkit Rickshaw provides the elements you need to create interactive graphs: renderers, legends, hovers, range selectors, etc.
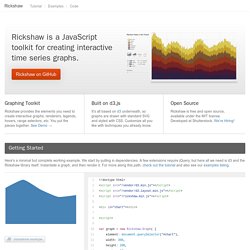
You put the pieces together. See Demo → Built on d3.js. Three.js - JavaScript 3D library. Getting Started with Three.js. ## Introduction I have used Three.js for some of my experiments, and it does a really great job of abstracting away the headaches of getting going with 3D in the browser.
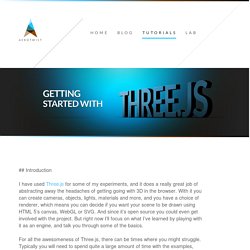
With it you can create cameras, objects, lights, materials and more, and you have a choice of renderer, which means you can decide if you want your scene to be drawn using HTML 5’s canvas, WebGL or SVG. And since it’s open source you could even get involved with the project. But right now I’ll focus on what I’ve learned by playing with it as an engine, and talk you through some of the basics. Processing.js. JavaScript Image ASCIIfier. Utilizing magic and the <canvas> element to turn internet images into sexy ASCII art Download : jsascii.js Example usage: Original image: ASCII image: jsAscii grabs the image from the page and paints it on a hidden canvas element.
The pixel data can then be retrieved from the canvas and converted into ASCII code. The following custom attributes can be set on image elements to control the ASCII conversion: Storm - processing example. The Labs - Experiments in JavaScript, Canvas and DHTML. GLSL Sandbox Gallery. BonsaiJS - A Graphics Library. A lightweight JavaScript graph drawing library.