

WinDesign Cartographie de l'organisation. Les aspects abordés Cette cartographie aborde les différents aspects de l'organisation d'une entreprise, et en particulier : La structuration en unités organisationnelles La répartition géographique en sites L'organigramme fonctionnel Les rôles et compétences des structures organisationnelles La plupart des concepts modélisés dans ces cartographies se retrouvent mis en oeuvre dans les autres cartographies (métier, applicative et technique).
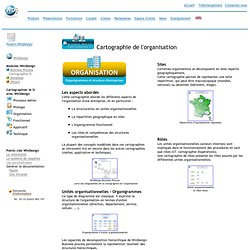
WinDesign Business Process carte des diagrammes de la cartographie de l'organisation Unités organisationnelles - Organigrammes Ce type de diagramme est classique. Il exprime la structure de l'organisation en termes d'unités organisationnelles (direction, département, service, cellule, ...). Organigramme d'unités organisationnelles Les capacités de décomposition hiérarchique de WinDesign Business process permettent la représention "zoomée" des structures hiérarchiques. Organigramme détaillé avec rôles et personnes. Org Chart Maker - iPad. Org Chart Maker is a powerful graphing tool for creating printable Organization charts on your iPad.
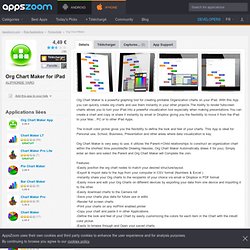
With this App you can quickly create org charts and use them instantly in your other projects.The Ability to render fullscreen charts allows you to turn your iPad into a powerful visualization tool especially when making presentations.You can create a chart and copy or share it instantly by email or Dropbox giving you the flexibility to move it from the iPad to your Mac , PC or to other iPad Apps. The in-built color picker gives you the flexibility to define the look and feel of your charts. This App is ideal for Personal use, School, Business, Presentation and other areas where data visualization is key. Org Chart Maker is very easy to use, it utilizes the Parent->Child relationships to construct an organization chart within the shortest time possible(No Drawing Hassles, Org Chart Maker Automatically draws it for you).
WinDesign Cartographie de l'organisation. Free Online Organization Chart - EasyOrgChart.com. Org Chart Software to Create Organization Charts Online. Org Chart Software Packed with Features Our org chart specific features like filtering makes it super easy to add/remove fields from your entire org chart in 1 click.
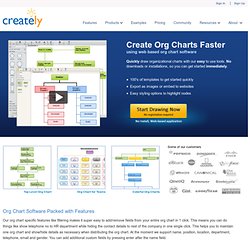
This means you can do things like show telephone no to HR department while hiding the contact details to rest of the company in one single click. This helps you to maintain one org chart and show/hide details as necessary when distributing the org chart. At the moment we support name, position, location, department, telephone, email and gender. You can add additional custom fields by pressing enter after the name field. Create Organization Charts Online: No Downloads, No Worries Will this work in my machine?
Organizational Network Analysis Surveys. yEd - Graph Editor. yEd is a powerful desktop application that can be used to quickly and effectively generate high-quality diagrams.
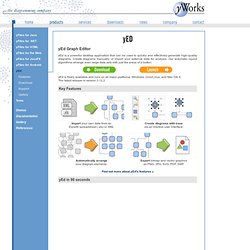
Create diagrams manually, or import your external data for analysis. Our automatic layout algorithms arrange even large data sets with just the press of a button. yEd is freely available and runs on all major platforms: Windows, Unix/Linux, and Mac OS X. The latest release is version 3.12.2 Key Features Import your own data from an Excel® spreadsheet (.xls) or XML Create diagrams with easevia an intuitive user interface. Automatically arrangeyour diagram elements.
Export bitmap and vector graphicsas PNG, JPG, SVG, PDF, SWF yEd in 90 seconds Supported Diagrams yEd supports a wide variety of diagram types. Support Resources The yEd online support resources include the yEd Graph Editor manual and the yEd forum where you can give us feedback. Thinkmap Visual Thesaurus - An online thesaurus and dictionary of over 145,000 words that you explore using an interactive map.
SEO Keyword Graph Visualization. Use this free Java application to explore the connections between related websites.
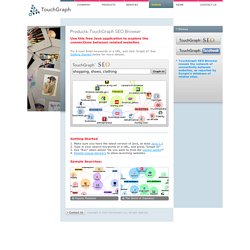
Try it now! Enter keywords or a URL, and click 'Graph it! ' See Getting Started below for more details. Getting Started Make sure you have the latest version of java, at least Java 1.5 Type in your search keywords or a URL, and press "Graph It! " EtherApe, a graphical network monitor. Netvis Module - Dynamic Visualization of Social Networks. Agora. Email constellations. Orgnet.com - Social Network Analysis software & services for organizations, communities, and their consultants. Social Network Analysis. Brief Description: "Social network analysis is the mapping and measuring of relationships and flows between people, groups, organisations, computers or other information/knowledge processing entities.
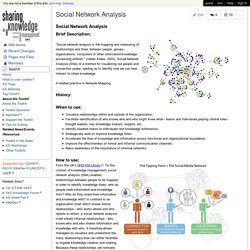
" (Valdis Krebs, 2002). Social Network Analysis (SNA) is a method for visualizing our people and connection power, leading us to identify how we can best interact to share knowledge. A related practice is Network Mapping. History: When to use: How to use: From the UK's NHS KM Library: "In the context of knowledge management, social network analysis (SNA) enables relationships between people to be mapped in order to identify knowledge flows: who do people seek information and knowledge from?
Informal Face to Face Network Mapping To highlight the value of our social networks, at a face to face gathering create an informal map using Post-it notes on a large piece of paper. Tools and Software for SNA Highly recommend. Training on SNA Tips and Lessons Learnt Examples & Stories (add yours) Tags. MapStan.net : your Web navigation plan.