
What is User Experience? What Is User Experience Design? Overview, Tools And Resources. Visual Business Intelligence – Graphical Journalists Should, First and Foremost, Be Journalists. It annoys me when I see poor journalistic infographics, in part, because I value journalism and I hate to see it done ineffectively.
Good news organizations take the quality of their journalist’s writing seriously. Journalists and their editors work hard to produce news stories that are accurate, clear, and compelling. Those who can’t write effectively lose their jobs. What is UX Design? 15 User Experience Experts Weigh In. [Infografik] 8 erstaunliche Zahlen über User Experience und UX-Design. Veröffentlicht: 18:22h in E-Commerce von Henning Groß Design ist eine Geschmacksfrage und über Geschmack kann man nicht streiten.
![[Infografik] 8 erstaunliche Zahlen über User Experience und UX-Design](http://cdn.pearltrees.com/s/pic/th/infografik-erstaunliche-116231505)
Dennoch scheiden sich am grafischen Konzept nicht selten die Geister – oder besser gesagt Kunde und Agentur. Bei der Entwicklung von Frontend-Designs geht es in den meisten Fällen jedoch nicht darum, dass das Ergebnis dem Auftraggeber oder der Agentur gefällt, sondern dem Endverbraucher – also dem späteren Nutzer der Seite. Dabei beeinflusst heute das UX-Design inzwischen das Aussehen von Webanwendungen immer stärker. Anhand folgender Fakten, die in den zurückliegenden Jahren in Studien und A/B-Tests ermittelt wurden, lässt sich leicht ablesen, wie planvoll und technisch man an die Konzeption und Umsetzung von Frontend-Aufgaben herangehen sollte. Um 15%-Punkte reduziere sich die Bounce-Rate von time.com seit Einführung von Endless Scrolling. Endless Scrolling reduziert das aktive Klicken des Nutzers. 13 Principles of Feel-good Design Interfaces that Improve User Experience. Designing Meaningful Aesthetics - Vanseo Design.
This weekend I came across a post from a few months back that seems to be making the rounds again.
Beyond Web Mechanics – Creating Meaningful Web Design by Mike Kus argues that designers should be making thoughtful choices in regards to the aesthetic decisions we make. He argues that we should create meaningful aesthetics. Mike’s post arose from a presentation Elliot Jay Stocks gave a few years back called “Destroy the Web 2.0 Look,” which makes a similar argument about choosing aesthetics because they enhance the content of the site and not because they happen to be trendy. 10 Principles Of Good Design: Dieter Rams - Vanseo Design. The Visual System as Statistician. A fundamental constraint on our performance of visual tasks is what we can see in a single glance.
If an alert "pops out" and draws our attention, we can easily and quickly notice it even if we are not looking right at it. If a driver can quickly glance at her GPS system and tell that she is approaching a left turn, she will more effectively use her GPS than if comprehending the display requires several glances. A complex diagram, like a subway map, is unlikely to be fully comprehended at a glance, but in a well designed map, the viewer has adequate information for planning his next glance, and for piecing together his route. The question of what our visual systems can perceive in a glance would be boring, except that processing is not uniform throughout the visual field. Infographics Science: The Surprising Way The Brain Processes Visuals. Infographics can contain a wealth of useful, interesting, and captivating information, but only if readers take the time to survey the entire graphic.
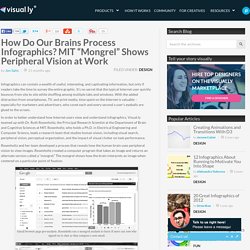
It’s no secret that the typical Internet user quickly bounces from site to site while shuffling among multiple tabs and windows. With the added distraction from smartphones, TV, and print media, time spent on the Internet is valuable – especially for marketers and advertisers, who covet each and every second a user’s eyeballs are glued to the screen. In order to better understand how Internet users view and understand infographics, Visual.ly teamed up with Dr. Ruth Rosenholtz, the Principal Research Scientist at the Department of Brain and Cognitive Sciences at MIT. Rosenholtz, who holds a Ph.D. in Electrical Engineering and Computer Science, leads a research team that studies human vision, including visual search, peripheral vision, perceptual organization, and the impact of visual clutter on task performance.
3 Beginner-Friendly Data Visualization Tricks. JCIS53-3-1. Visual content: 5 things you should know. Did you know that 90 percent of information transmitted to the brain is visual, and our brains process visuals 60,000 times faster than text?
* That, along with how easy it now is to access (more) data and share content via social tools, explains the popularity of infographics we’ve seen in recent years. But going from text to visual content is a big shift for many of us; consider these five things before you start. Visuals turn on parts of the brain that words cannot, which is why infographics are infiltrating external content strategies for deeper audience engagement. And judging by the level of interest in this topic we’re hearing, internal communicators are also eager to move away from words and towards visuals, to turn complex (and sometimes dull) business information into something meaningful. From a vision to a sticky visual story. The science behind storytelling. Emotionally engaging stories affect more areas of the brain than rational, data-driven messages – meaning that they are far more likely to resonate with your employees.
Jenny Nabben explains the neuroscience behind this, and how you can use it to showcase the benefits of storytelling. Across every culture, in every part of the world, humans have told stories to understand, share and recall knowledge. While our ancestors sat around the camp fire listening to the tribal storyteller, we now sit in cinemas, theaters or in front of TVs, computers and mobile phones to share the stories of our lives.
In fact, the universal nature of storytelling may explain our shared, evolved human psyche. One of the brain’s unique design features is its ability to recognize patterns so that we can quickly predict what is most likely to happen next. Booker’s research states that when we get to the heart of the stories we tell, we notice these common themes. Your brain on facts Your brain on fiction. The Neuroscience Behind Color.