
Mobile & Web Analytics and Marketing Platform. Big Data Analytics, Big Data Hadoop - Datameer. Kibana: Explore, Visualize, Discover Data. Cloud Business Intelligence. Snappa - The Easiest Graphic Design Tool You'll Ever Use. Create and share visual ideas online.
Polarr: professional free online photo editor. Fotor - Photo Editing & Collage Maker & Graphic Design. Visage.co - Visual Content Creation Made Simple. Pourquoi LVMH a préféré Microsoft Datazen à Qlik et Tableau pour son reporting RH. LVMH, groupe de 130 000 personnes gère 70 maisons prestigieuses dans le domaine des vins & spiritueux (Château d'Yquem, Moët et Chandon, Dom Pérignon), la mode (Louis Vuitton, Christian Dior, Givenchy), les parfums, les montres ou encorela joaillerie.
Une petite équipe s'occupe, à la holding, de consolider l'ensemble des données RH du groupe pour assurer un suivi de l'effectif et, annuellement, produire les documents de référence et les rapports annuels avec tous les indicateurs sociaux du groupe. Une fois ces données collectées auprès des "maisons", la RH de la holding leur envoyait des fichiers PDF pas très simples à manipuler. « Tous les mois, nous leur faisions parvenir 70 pages où elles pouvaient trouver l'ensemble des données dont elles pouvaient avoir besoin » explique Nicolas Berton, Group HR Data Manager chez LVMH.
Datazen – Mobile BI and Data Analytics for Any Device. Outils et techniques de communication visuelle, campagne native advertising. 25 Innovative Dashboard Concepts and Designs. Dashboard design is a tricky business.
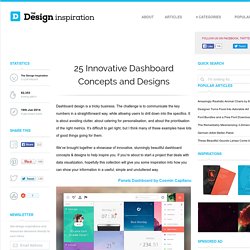
The challenge is to communicate the key numbers in a straightforward way, while allowing users to drill down into the specifics. It is about avoiding clutter, about catering for personalisation, and about the prioritisation of the right metrics. It’s difficult to get right, but I think many of these examples have lots of good things going for them. We’ve brought together a showcase of innovative, stunningly beautiful dashboard concepts & designs to help inspire you.
24 beautifully-designed web dashboards that data geeks will love. We live in a world of big (and little) data, and many people have to make sense of numbers as part of their job.
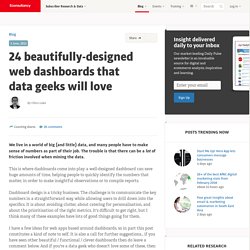
The trouble is that there can be a lot of friction involved when mining the data. This is where dashboards come into play: a well-designed dashboard can save huge amounts of time, helping people to quickly identify the numbers that matter, in order to make insightful observations or to compile reports. Dashboard design is a tricky business. The challenge is to communicate the key numbers in a straightforward way, while allowing users to drill down into the specifics. It is about avoiding clutter, about catering for personalisation, and about the prioritisation of the right metrics. I have a few ideas for web apps based around dashboards, so in part this post constitutes a kind of note to self.
Toutapp Lancaster Bingo Company By Danny Amacher. Understanding what makes a visualization memorable. John Wihbey teaches data journalism in the Media Innovation program at Northeastern University’s School of Journalism.
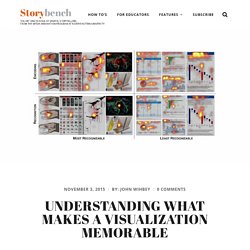
The world of data visualization has long been shaped by canonical ideas from theorists like Edward Tufte. His book The Visual Display of Quantitative Information is a must-read for information designers, which include newsroom graphics editors. Tufte’s organizing principles–the eloquent and ethical display of substance, statistics, and design–are now being refined and adapted for media production by contemporary dataviz gurus like Alberto Cairo. Advanced visualization. Democratizing visualization Advanced visualization from IBM can help you gain insight from the myriad of data that your company generates.
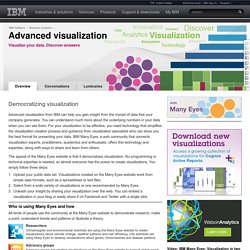
You can understand much more about the underlying numbers in your data when you can see them. For your visualization to be effective, you need technology that simplifies the visualization creation process and guidance from visualization specialists who can show you the best format for presenting your data. IBM Many Eyes, a web community that connects visualization experts, practitioners, academics and enthusiasts, offers this technology and expertise, along with ways to share and learn from others. The appeal of the Many Eyes website is that it democratizes visualization. Upload your public data set. Who is using Many Eyes and how All kinds of people use the community at the Many Eyes website to demonstrate research, make a point, understand trends and patterns or illustrate a theory.
Datazen Overview. Piktochart, pour des infographies interactives : Quatre sites pour créer gratuitement des infographies. Datawrapper. Looking 4 data visualization: analytics. Chart selection 1.
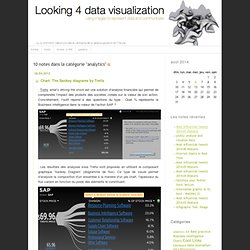
ChartChooser from Juice Analytics2. Charts suggestions from Andrew Abela3. Graph Selection Matrix from Perceptual Edge4. Periodic table of visualization from Visual Literacy 5. Color chooser and Font Selection1. Latest Project - BrightPoint Inc. Excel 2013 tutorial francais power view. Foter: Free Stock Photos & Images. Datavisualization.ch Selected Tools. For education online animated presentation software. Piktochart: Infographic and Graphic Design for Non-Designers.
InfoViz & DataViz. Dataviz : les outils gratuits indispensables. Mar132012 La visualisation des données (dataviz) est devenu la nouvelle marotte des rédactions connectées. m0le'o'blog vous propose une petite sélection des meilleurs outils gratuits.
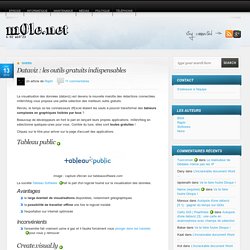
Révolu, le temps où les connaisseurs d'Excel étaient les seuls à pouvoir transformer des tableurs complexes en graphiques lisibles par tous ? Beaucoup de développeurs en font le pari en lançant leurs propres applications. m0le'o'blog en sélectionne quelques-unes pour vous. Comble du luxe, elles sont toutes gratuites ! Cliquez sur le titre pour arriver sur la page d'accueil des applications.