
10 free tools for creating infographics. Done right, infographics can be a great way to make sense of complex data.
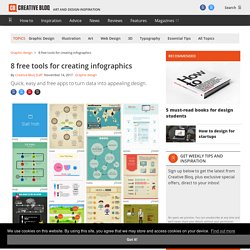
The best infographics transform complex information and data into graphics that are both easy to grasp and visually appealing. The only problem is, infographics that look like they were simple to make are often anything but. Exclusive offer: Save 15% on Adobe Creative Cloud now Here, we've selected our top free tools and apps for making infographics. Some of the options here are even suitable for non-designers, as templates and other features make them easy to use. Give these free tools a try and let us know which ones you get on best with on Facebook or Twitter. 01. Visme promises to help you 'speak visually'. 02. Canva is a powerful and easy-to-use online tool that's suitable for all manner of design tasks, from brochures to presentations and much more besides. 03. Google's chart tools are powerful, simple to use, and free. 04. 05. 06. 07. 08.
Related articles: 46 Tools To Make Infographics In The Classroom. Infographics are interesting–a mash of (hopefully) easily-consumed visuals (so, symbols, shapes, and images) and added relevant character-based data (so, numbers, words, and brief sentences).
The learning application for them is clear, with many academic standards–including the Common Core standards–requiring teachers to use a variety of media forms, charts, and other data for both information reading as well as general fluency. It’s curious they haven’t really “caught on” in schools considering how well they bridge both the old-form textbook habit of cramming tons of information into a small space, while also neatly overlapping with the dynamic and digital world. So if you want to try to make infographics–or better yet have students make them–where do you start?
The 46 tools below, curated by Faisal Khan, are a good place to start. 5 Tools For Creating Your Own Infographics. Five years ago, almost nobody knew what the heck an infographic was.
(I sure didn’t, and I was a graphic design major in college at the time.) Now that the infographic craze has saturated us with new visual knowledge (and marketing gimmicks), something interesting has happened: The creation of infographics has become democratized. No longer is the act of creating a visual data story confined to professional designers using professional tools like Adobe Illustrator or Photoshop. Now anyone with a data set can build an infographic. (See also 5 Business & Design Tools Every Tech Freelancer Should Learn.) 10 Basic Tips To Build A Responsive Design [Infographic] Popular Today in Business: All Popular Articles If your website isn’t mobile friendly by now, chances are you are losing a substantial amount of customers.
![10 Basic Tips To Build A Responsive Design [Infographic]](http://cdn.pearltrees.com/s/pic/th/responsive-design-infographic-81141292)
You cannot ignore the fact that many people are visiting your sites on their smartphones and tablets. A 2011 statistics shows that there was an estimated 5 billion phones in the world, out of which 1 billion were smart phones. 84% of those 1 billion smart phones were used to browse the web, that’s 840,000,000 phones browsing the web. So just imagine the figure. There is no iota of doubt that web and the mobile browsers remain one of the best ways that users interact with their preferable websites and if they face any trouble on their smartphones while browsing be dead sure that that particular customer is gone forever. Responsive Website Design – What is it? [INFOGRAPHIC] Responsive website design seems to be a buzzword in the internet marketing world these days.
![Responsive Website Design – What is it? [INFOGRAPHIC]](http://cdn.pearltrees.com/s/pic/th/responsive-website-infographic-81141278)
But what is it, really – and why should you pay attention? In the web marketing and development space, new things are popping up every single day – and many fizzle just as quickly as they appear. Responsive design has been around for some time now, and it’s gained traction as a preferred website design practice for many web developers. The infographic below helps to explain the basics of responsive website design: what it is, how it works and the major benefits. In short, responsive website design is just what it sounds like: it allows your site to respond directly to the device that it is being viewed on. Studies show that 46% of mobile users report having difficulty interacting with a webpage – and 44% complain that navigation was difficult. With mobile use on the rise, more and more people are browsing the web from several different devices. The Value of a Responsive Infographic.