
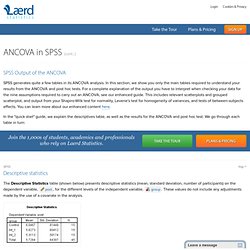
Cse.fra.affrc.go.jp/kiyo/home/info_ex/seminor/Grafen/RNews_lme4.pdf. One-way ANOVA with repeated measures in SPSS - Understanding and reporting the output. Within-Subjects Factors Table This table reminds us of the levels of our independent variable (within-subject factor) and labels the time points 1, 2 and 3.
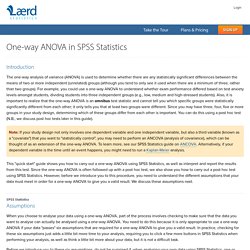
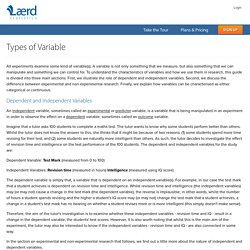
We will need these labels later on when analysing our results in the Pairwise Comparisons table. Take care not to get confused with the "Dependent Variable" column in this table because it seems to suggest that the different time points are our dependent variable. This is not true - the column label is referring to fact that the dependent variable "CRP" is measured at each of these time points. Published with written permission from SPSS Inc., an IBM Company. Descriptive Statistics Table. Repeated Measures ANOVA - Understanding a Repeated Measures ANOVA. Reporting the Result of a Repeated Measures ANOVA We report the F-statistic from a repeated measures ANOVA as: F(dftime, dferror) = F-value, p = p-value which for our example would be: F(2, 10) = 12.53, p = .002 This means we can reject the null hypothesis and accept the alternative hypothesis.
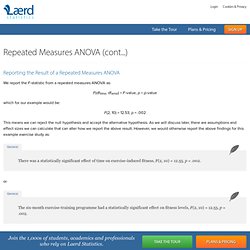
General There was a statistically significant effect of time on exercise-induced fitness, F(2, 10) = 12.53, p = .002. or The six-month exercise-training programme had a statistically significant effect on fitness levels, F(2, 10) = 12.53, p = .002. Tabular Presentation of a Repeated Measures ANOVA Normally, the result of a repeated measures ANOVA is presented in the written text, as above, and not in a tabular form when writing a report.
Most often, the Subjects row is not presented and sometimes the Total row is also omitted. Which is similar to the output produced by SPSS. Repeated Measures ANOVA - Understanding a Repeated Measures ANOVA. Introduction Repeated measures ANOVA is the equivalent of the one-way ANOVA, but for related, not independent groups, and is the extension of the dependent t-test.
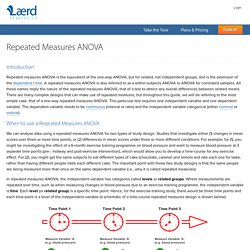
A repeated measures ANOVA is also referred to as a within-subjects ANOVA or ANOVA for correlated samples. All these names imply the nature of the repeated measures ANOVA, that of a test to detect any overall differences between related means. Testing for Normality using SPSS when you have only one independent variable. Introduction An assessment of the normality of data is a prerequisite for many statistical tests because normal data is an underlying assumption in parametric testing. There are two main methods of assessing normality: graphically and numerically. This "quick start" guide will help you to determine whether your data is normal, and therefore, that this assumption is met in your data for statistical tests. The approaches can be divided into two main themes: relying on statistical tests or visual inspection. Statistical tests have the advantage of making an objective judgement of normality, but are disadvantaged by sometimes not being sensitive enough at low sample sizes or overly sensitive to large sample sizes.
If you want to be guided through the testing for normality procedure in SPSS Statistics for the specific statistical test you are using to analyse your data, we provide comprehensive guides in our enhanced content. Cse.fra.affrc.go.jp/kiyo/home/info_ex/seminor/Grafen/RNews_lme4.pdf. Mixed Models in R: lme4, nlme, or both? The topic of Mixed Models is an old-friend of this blog, but I want to focus today on the R code for these models.
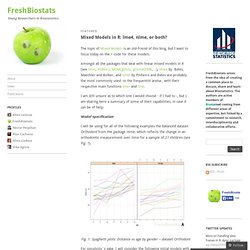
Amongst all the packages that deal with linear mixed models in R (see lmm, ASReml, MCMCglmm, glmmADMB,…), lme4 by Bates, Maechler and Bolker, and nlme by Pinheiro and Bates are probably the most commonly used -in the frequentist arena-, with their respective main functions lmer and lme. I am still unsure as to which one I would choose - if I had to -, but I am sharing here a summary of some of their capabilities, in case it can be of help: Model specification I will be using for all of the following examples the balanced dataset Orthodont from the package nlme, which reflects the change in an orthodontic measurement over time for a sample of 27 children (see Fig. 1).
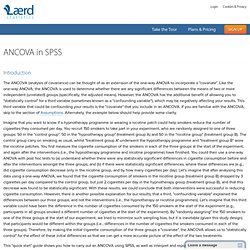
Fig. 1. For simplicity´s sake, I will consider the following initial models with a simple random factor (please see ref. [3] for centering and further analysis): Tests lmer Fixed effects: Understanding and reporting the output. SPSS Output of the ANCOVA SPSS generates quite a few tables in its ANCOVA analysis.
In this section, we show you only the main tables required to understand your results from the ANCOVA and post hoc tests. For a complete explanation of the output you have to interpret when checking your data for the nine assumptions required to carry out an ANCOVA, see our enhanced guide. One-way ANOVA in SPSS - Step-by-step procedure including testing of assumptions. Introduction The one-way analysis of variance (ANOVA) is used to determine whether there are any statistically significant differences between the means of two or more independent (unrelated) groups (although you tend to only see it used when there are a minimum of three, rather than two groups).
For example, you could use a one-way ANOVA to understand whether exam performance differed based on test anxiety levels amongst students, dividing students into three independent groups (e.g., low, medium and high-stressed students). Also, it is important to realize that the one-way ANOVA is an omnibus test statistic and cannot tell you which specific groups were statistically significantly different from each other; it only tells you that at least two groups were different.
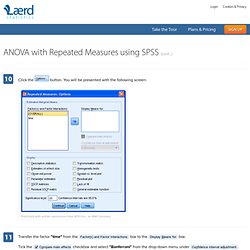
Since you may have three, four, five or more groups in your study design, determining which of these groups differ from each other is important. Understanding the different types of variable in statistics. All experiments examine some kind of variable(s).
A variable is not only something that we measure, but also something that we can manipulate and something we can control for. To understand the characteristics of variables and how we use them in research, this guide is divided into three main sections. First, we illustrate the role of dependent and independent variables. Second, we discuss the difference between experimental and non-experimental research. Finally, we explain how variables can be characterised as either categorical or continuous. Dependent and Independent Variables An independent variable, sometimes called an experimental or predictor variable, is a variable that is being manipulated in an experiment in order to observe the effect on a dependent variable, sometimes called an outcome variable. Imagine that a tutor asks 100 students to complete a maths test. How to perform an ANCOVA in SPSS. Introduction The ANCOVA (analysis of covariance) can be thought of as an extension of the one-way ANOVA to incorporate a "covariate".
Like the one-way ANOVA, the ANCOVA is used to determine whether there are any significant differences between the means of two or more independent (unrelated) groups (specifically, the adjusted means). However, the ANCOVA has the additional benefit of allowing you to "statistically control" for a third variable (sometimes known as a "confounding variable"), which may be negatively affecting your results. This third variable that could be confounding your results is the "covariate" that you include in an ANCOVA. If you are familiar with the ANCOVA, skip to the section of Assumptions.
Imagine that you want to know if a hypnotherapy programme or wearing a nicotine patch could help smokers reduce the number of cigarettes they consumed per day. SPSStop ^ Assumptions You can check assumptions #4, #5, #6, #7, #8 and #9 using SPSS. Example.