
1 Getting started. Forecasting has fascinated people for thousands of years, sometimes being considered a sign of divine inspiration, and sometimes being seen as a criminal activity.
The Jewish prophet Isaiah wrote in about 700 BC Tell us what the future holds, so we may know that you are gods. (Isaiah 41:23) BBC Radio 4 - Ben Goldacre's Bad Evidence. Forecasting: principles and practice. Stove Ownership. Significant. Significant. Test, Learn, Adapt: Developing Public Policy with Randomised Controlled Trials. Testing Treatments interactive. What are fair tests of treatments? - Testing Treatments interactive » Testing Treatments interactive. Not all evidence is created equal: some tests of treatments are more reliable than others.

Sometimes tests of treatments can be biased in favour of a particular result, sometimes the results occur by chance, and sometimes they are asking the wrong question in the first place. This section of TTi is about how to tell whether a particular study is a fair test of a treatment. Only fair tests can give us reliable evidence about the effects of treatments. Why do we need fair tests of treatments? - Testing Treatments interactive » Testing Treatments interactive. Modern medicine has been hugely successful at reducing the impact of disease and increasing life expectancy.

In spite of this, too much medical decision making is based on insufficient evidence. As a result, doctors and other health professionals have sometimes harmed patients instead of helping them. Why do we need fair tests of treatments? - Testing Treatments interactive » Testing Treatments interactive. BBC Radio 4 - Ben Goldacre's Bad Evidence. Forecasting: principles and practice. Www.cdc.gov/nchs/video/nhanes_participants/participant_english.pdf. NHANES - Video - Participants. Sampling frame. Importance of the sampling frame is stressed by Jessen:[3] In many practical situations the frame is a matter of choice to the survey planner, and sometimes a critical one. [...]
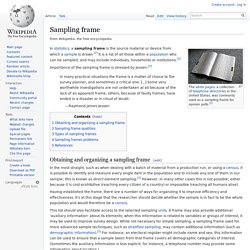
Some very worthwhile investigations are not undertaken at all because of the lack of an apparent frame; others, because of faulty frames, have ended in a disaster or in cloud of doubt. —Raymond James Jessen Obtaining and organizing a sampling frame[edit] Loaded question. A loaded question or complex question fallacy is a question which contains a controversial or unjustified assumption (e.g., a presumption of guilt).[1] Aside from being an informal fallacy depending on usage, such questions may be used as a rhetorical tool: the question attempts to limit direct replies to be those that serve the questioner's agenda.[2] The traditional example is the question "Have you stopped beating your wife?
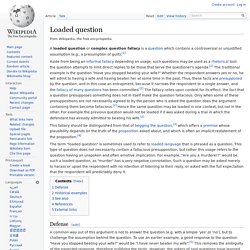
" Whether the respondent answers yes or no, he will admit to having a wife and having beaten her at some time in the past. CL-1: Field-tested Learning Assessment Guide (FLAG): Tools. CL-1: Field-tested Learning Assessment Guide (FLAG): Tools. StatThink - Statistical Thinking Diagrams and Models. From: Pfannkuch, M., Regan, M., Wild, C. and Horton, N.J. (2010) Telling Data Stories: Essential Dialogues for Comparative Reasoning.Journal of Statistics Education, 18(1).
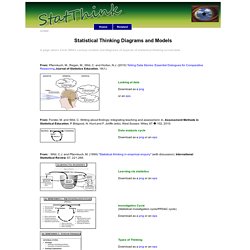
Looking at data Download as a png or an eps. 200 Countries, 200 Years, 4 Minutes. Hans Rosling explains a very common misunderstanding about the world: That saving the poor children leads to overpopulation.
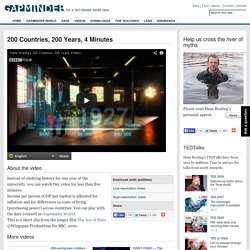
Not only is it not right, it’s the other way around! The world might not be as bad as you might believe! Www.istics.net/Correlations/ Spurious Correlations. iNZight for Data Analysis. Quick Explore Tools for familiarising yourself with a new data set: Missing Values Plots and summary tables of the extent to which variables and combinations of variables have missing values All 1-variable Plots Steps through and plots every (single) variable in the data set All 1-variable Summaries Summaries for every (single) variable in the data set Explore 2-variable Plots Takes a user-selected variable and then steps through plotting every other variable in the data set against it Pairs Takes a set of user-variables and plots every variable against every other variable as a matrix of plots.
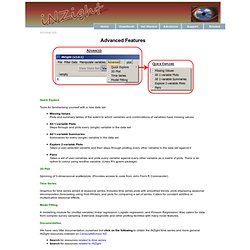
There is an option to colour using another variable. (Uses R's gpairs package) 3D Plot. Boyfriend. 2.2-categorical-variables-illustrated.pdf. 2.2-categorical-variables.pdf. Video-transcript-week2-statistics-boot-camp.pdf. Psychographic Analysis of Consumers — Moonshadow Mobile. Moonshadow has created Consumermapping, a tool to perform detailed demographic and psychographic analysis of consumers.
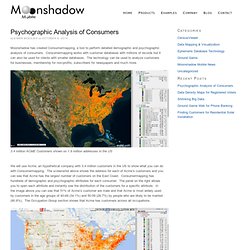
Consumermapping works with customer databases with millions of records but it can also be used for clients with smaller databases. The technology can be used to analyze customers for businesses, membership for non-profits, subscribers for newspapers and much more. iNZight for Data Analysis. Talks:Chris Wild. NHANES - National Health and Nutrition Examination Survey Homepage. The National Health and Nutrition Examination Survey (NHANES) is a program of studies designed to assess the health and nutritional status of adults and children in the United States.
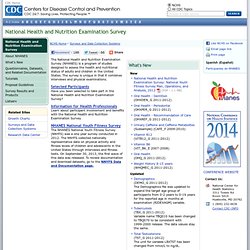
The survey is unique in that it combines interviews and physical examinations. Selected Participants Have you been selected to take part in the National Health and Nutrition Examination Survey? Information for Health Professionals Learn about participant involvement and benefits with the National Health and Nutrition Examination Survey. iNZight for Data Analysis. NHANES - National Health and Nutrition Examination Survey Homepage. Gapminder: Unveiling the beauty of statistics for a fact based world view. iNZight for Data Analysis.