
Extra! Extra! Get Your gridExtra! The more I use it, the deeper I fall in love with ggplot2.

I know, some of you have heard me kvel about it ad nauseum (oh, yiddish and latin in one sentence – extra points!). But the graphs really look great, and once you wrap your head around a few concepts, it’s surprisingly easy to make it do most anything you want. Except for one thing. One thing I loved about the old R plotting functions was the ability to setup panels easily, and fill them with totally different graphs.
Ye olde par(mfrow=c(2,2)) for a 2 x 2 grid, for example. Enter gridExtra. What exactly do I mean? To do this in ggplot2, and with a single commend to put them in a single window, first you need to melt the data with reshape2 so that the column names are actually grouping variables, and then you can plot it. This produces a nice graph. So, let's see the same example, but with gridExtra. "Oh, what a trivial problem," you may now be saying. This is all well and good, but, simple. #First, the correlation. Web.udl.es/Biomath/Bioestadistica/R/Grafics/ggplot2.pdf.
Producing Simple Graphs with R. Create HTML or PDF Files with R Knitr MikTex Pandoc. How to create HTML or PDF files with R, Knitr, MiKTeX This page will show you how to create HTML or PDF output from R.

It’s complicated, but can be really useful! Step 1: Install MiKTeX Go to and follow the instructions to install MiKTeX on your computer. During the installation process be sure to change Preferred Paper from A4 to Letter if necessary.You do not need to install this if you only want HTML output and no PDF output. Step 2: Install Pandoc Go to and follow the instructions to install Pandoc on your computer. Code Externalization: Use an external R script with your document. You do not have to put the R code in the input document; with knitr, you can separate your input document with the R script (think the reverse of Stangle).
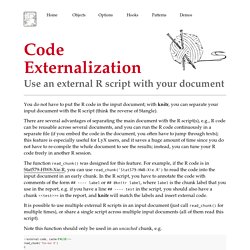
There are several advantages of separating the main document with the R script(s), e.g., R code can be reusable across several documents, and you can run the R code continuously in a separate file (if you embed the code in the document, you often have to jump through texts); this feature is especially useful for LyX users, and it saves a huge amount of time since you do not have to re-compile the whole document to see the results; instead, you can tune your R code freely in another R session. The function read_chunk() was designed for this feature. LMU - Prof. Friedrich Leisch. What is Sweave?
Sweave is a tool that allows to embed the R code for complete data analyses in latex documents. The purpose is to create dynamic reports, which can be updated automatically if data or analysis change. Instead of inserting a prefabricated graph or table into the report, the master document contains the R code necessary to obtain it. When run through R, all data analysis output (tables, graphs, etc.) is created on the fly and inserted into a final latex document. The report can be automatically updated if data or analysis change, which allows for truly reproducible research. Where can I get it? The Sweave software itself is part of every R installation, see help("Sweave", package="utils") Documentos de Latex que incluyen código de R. <strong>CREACION DE DOCUMENTOS HTML CON EL PAQUETE KNITR DE R.</strong> Por Carlos LESMES Universidad Santo Tomás. email: lesmes@member.ams.org twitter: @carloslesmes3 Con el fin incentivar la escritura de artículos y de desarrollos estadísticos de los estudiantes y docentes en la faculatd de Estadística de la USTA, este post, muestra como crear documentos HTML.
LMU - Prof. Friedrich Leisch. El blog de los erreros: knitr: Un paquete avanzado para la edición de informes dinámicos. El paquete knitr de Yihui Xie se ha diseñado para superar algunos problemas de Sweave y avanzar en la edición de informes dinámicos con R.
Una fórmula del propio autor resume el conjunto de aplicaciones incluidas en el paquete: knitr ≈ Sweave + cacheSweave + pgfSweave + weaver + R2HTML::RweaveHTML + highlight::HighlightWeaveLatex + 0.2 * brew + 0.1 * SweaveListingUtils + more Las ventajas sobre Sweave son múltiples. En primer lugar y lo más evidente es el coloreado del código, pero también la habilidad para formatear el código automáticamente. Este paquete incluye el soporte para varios dispositivos gráficos, entre ellos el tikzDevice que traduce el gráfico a código LaTeX y, por lo tanto, escribir fórmulas en LaTeX dentro del gráfico en la misma fuente que el texto. Index. ggplot2 0.9.3.1. Theme. ggplot2 0.9.3. R Tutorial — R Tutorial. Cran.r-project.org/doc/contrib/rdebuts_es.pdf.
Aggregate. It is relatively easy to collapse data in R using one or more BY variables and a defined function. # aggregate data frame mtcars by cyl and vs, returning means # for numeric variables attach(mtcars) aggdata <-aggregate(mtcars, by=list(cyl,vs), FUN=mean, na.rm=TRUE) print(aggdata) detach(mtcars) When using the aggregate() function, the by variables must be in a list (even if there is only one).
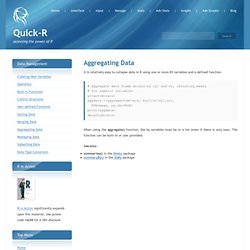
The function can be built-in or user provided. See also: summarize() in the Hmisc package summaryBy() in the doBy package. #!/perl/bioinfo: Algunos comandos de R útiles en ciencia e investigación. Introducción. R news & tutorials from the web. Cran.r-project.org/doc/contrib/rdebuts_es. Cran.r-project.org/web/packages/xlsx/xlsx. RStudio - Home. The R Project for Statistical Computing.