
The 14 Best Data Visualization Tools. Nishith Sharma is the co-founder of frrole, a social intelligence startup.
Raw data is boring and it’s difficult to make sense of it in its natural form. Add visualization to it and you get something that everybody can easily digest. Not only you can make sense of it faster, but you can also observe interesting patterns that wouldn’t be apparent from looking only at stats. All Killer, No Filler This one’s different, trust us. Why Are Data-Viz Designers So Obsessed With Circles? In 1726, Filippo Juvarra put the finishing touches on the dome of the Basilica of Superga, an intricately designed church in Turin, Italy.
The artist painted the interior roof of the building with a kaleidoscopic pattern that when paired with the dome’s ring of windows creates the effect of ornate, concentric circles. Nearly 300 years later, in the French town of Cessy, engineers finished building the Compact Muon Solenoid, a massive particle detector that, when viewed in cross-section, bears a striking resemblance to Juvarra’s circular basilica dome. “These things look so similar, and yet they’re separated by 300 years,” says Manuel Lima. “One is all about religion and spirituality and the other is about science.”
J.L. Steenwyk. How to design an excellent scientific poster. ‘Science is not finished until it is communicated’, so said Sir Mark Walport, former medical scientist and the Chief Executive of the UK Research and Innovation (UKRI).
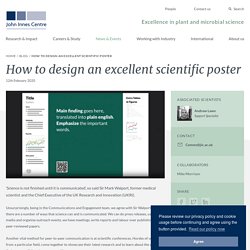
Unsurprisingly, being in the Communications and Engagement team, we agree with Sir Walport, and there are a number of ways that science can and is communicated. We can do press releases, use social media and organise outreach events, we have meetings, write reports and labour over publishing peer-reviewed papers. Another vital method for peer-to-peer communication is at scientific conferences.
How to design an award-winning conference poster. A good academic conference poster serves a dual purpose: it is both an effective networking tool and a means by which to articulately communicate your research.
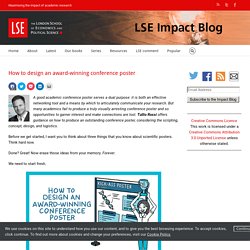
But many academics fail to produce a truly visually arresting conference poster and so opportunities to garner interest and make connections are lost. Tullio Rossi offers guidance on how to produce an outstanding conference poster, considering the scripting, concept, design, and logistics. Before we get started, I want you to think about three things that you know about scientific posters. Think hard now. Instant Maps with kepler.gl – ProfHacker - Blogs - The Chronicle of Higher Education. Kepler.gl, an open source tool for mapping large-scale spatial data. Le dessous des cartes. Viewable. Le Dessous des cartes - Info et société. Visual Literacy.
Computer Vision Course at Stanford. Your Friendly Guide to Colors in Data Visualisation. Simple tools for mastering color in scientific figures. Call me a procrastinator but I strongly believe that spending time to select a good color scheme can work miracles with a plot, paper, or presentation.
In science, it’s generally not expected that you invest time into a thought process on something like aesthetics. I would dare to go as far as to say that it’s sometimes outright frowned upon if you do. Data Aesthetics. Data Viz. Revealing. Data Visualization. Data visualisation tools. Data Visualization. Underground. Accuracy. Mathematics. Artistic.ally. Photo Graphy. Population Growth. Video Media. World.