
Human Terrain. Worldometer - real time world statistics. SEDAC's Population Estimation Tools. L'âge des frontières dans le monde. Pourquoi dit-on “Australie”, “Chine”, “France” ou “Inde” ? La grande histoire du climat - Dossier #2 - L'Esprit Sorcier. Ventusky - Wind, Rain and Temperature Maps. Resourcetrade.earth. Quneitra: pro-Government forces seized back most of positions Rebels took yesterday on Baath City front - syria.liveuamap.com. 3 hours ago Soldiers from the SAA are reporting the Israeli military attacked their positions near the Old Government building in the Golan Syrian Brig General Fouad Kaddour died in East Homs today.
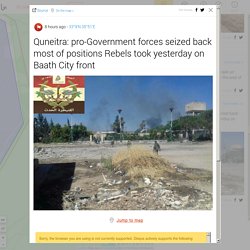
Hes been a primary commander there since the recent fighting started in Dec '16 Russia's state TV: "It's crowded in Syria," Russia "essentially created a no-fly zone for Americans. " Villages in Northern Hama under shelling Bombardment of Eastern Damascus this morning 4 hours ago Israeli air force reportedly striking targets in Syria following mortar impacts in the Golan Israeli army says number of mortars have landed in Israel's Ramat HaGolan due to fighting in Syria. IDF: Moments ago, several projectiles fired from Syria hit an open area in the northern Golan Heights. #WrathOfEuphrates: SDF try 2 isolate Division 17 from North Raqqa city, whereas MMC fighters try to finish encircling city in south part Harakat Hizbullah An-Nujaba convoy in the Syrian badiya along the Iraqi border. 5 hours ago NW.
Carte des cybermenaces en temps réel. Le classement des villes mondiales/globales, version 2016. Le groupe de travail sur les villes mondiales du département de géographie de l'université de Loughborough a publié en mars 2017 la version 2016 de son glassement des villes mondiales/globales (le GaWC utilise cette double dénomination, voir notre entrée de glossaire Villes globales, villes mondiales).

En voici les premières lignes (le tableau complet ici) : Le haut du classement connaît quelques réajustements par rapport à la version de 2012 : Paris passe derrière Singapour, Tokyo derrière Pékin, Sydney derrière Doubaï. Le GaWC propose également un portail de ressources pédagogique (en anglais) où on trouvera la carte de 1998 en forme d'archipel des villes mondiales, ou encore celle de 2010 qui insiste sur les interrelations entre les villes :
This video ultimately explains why all world maps are wrong. A history of global living conditions in 5 charts - Our World In Data. This is the introduction to Our World in Data – the web publication that shows how global living conditions are changing.
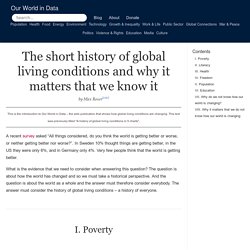
This text was previously titled "A history of global living conditions in 5 charts". A recent survey asked “All things considered, do you think the world is getting better or worse, or neither getting better nor worse?”. In Sweden 10% thought things are getting better, in the US they were only 6%, and in Germany only 4%. Very few people think that the world is getting better. What is the evidence that we need to consider when answering this question? I. To see where we are coming from we must go far back in time. 30 or even 50 years are not enough. Take a longer perspective and it becomes very clear that the world is not static at all.
To avoid portraying the world in a static way – the North always much richer than the South – we have to start 200 years ago before the time when living conditions really changed dramatically. II. III. IV. V. VI. Portraits d'un Nouveau Monde. Ressources de géographie pour les enseignants. The true size of countries.