
Europas flaggor. Kobra: Vart är kartan på väg? Bättre Konst - Jordglobsfabrik. Outline Maps. Free maps, free blank maps, free outline maps, free base maps. Watch - Upptäck. A global map of wind, weather, and ocean conditions. Kartan by Jörgen Lilliesköld on Prezi. D-maps.com : free maps, free blank maps, free outline maps, free base maps. Le Paper Globe — a DIY paper terrestrial globe. RT Play - Watch as the world’s cities appear one-by-one... Isländsk turist ritade en karta istället för adress – kom fram.
Seismic Monitor - Recent earthquakes on a world map and much more. World and Continents - Print Free Maps Large or Small. Maps Have Been Lying To You Your Entire Life. The truth is that every map tells a lie, but they don’t all lie about the same thing.
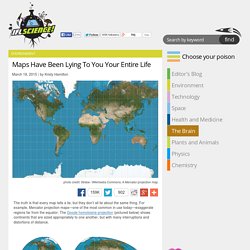
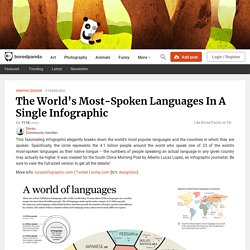
For example, Mercator projection maps—one of the most common in use today—exaggerate regions far from the equator. The Goode homolosine projection (pictured below) shows continents that are sized appropriately to one another, but with many interruptions and distortions of distance. Image Credit: Strebe / Wikimedia Commons This give-and-take of benefits has been a perennial problem in cartography.
The issue is due to projection, which in map-making results from trying to turn a spherical globe into a flat plane. One of the most popular projections is the Mercator, but of course, it too has its flaws. However, don’t get the idea that the Mercator is a bad map. Since there is no perfect map for all occasions, your best bet is to pinpoint what you need a map for and then to weigh the advantages and disadvantages of each to suit your goal.
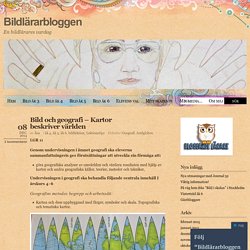
Read this next: Neanderthals Used Eagle Talons to Make Jewelry. The World’s Most-Spoken Languages In A Single Infographic. This fascinating infographic elegantly breaks down the world’s most popular languages and the countries in which they are spoken.
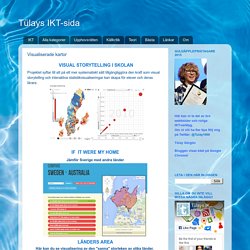
Specifically, the circle represents the 4.1 billion people around the world who speak one of 23 of the world’s most-spoken languages as their native tongue – the numbers of people speaking an actual language in any given country may actually be higher. It was created for the South China Morning Post by Alberto Lucas Lopez, an infographic journalist. Be sure to view the full-sized version to get all the details! Geografi. Europe: Free maps, free blank maps, free outline maps, free base maps. Bild och geografi – Kartor beskriver världen. Genom undervisningen i ämnet geografi ska eleverna sammanfattningsvis ges förutsättningar att utveckla sin förmåga att: göra geografiska analyser av omvärlden och värdera resultaten med hjälp av kartor och andra geografiska källor, teorier, metoder och tekniker, Undervisningen i geografi ska behandla följande centrala innehåll I årskurs 4–6.
Så blir vi lurade av "platta" kartor - Streama TV4 Play. Så blir vi lurade av "platta" kartor - Streama TV4 Play. Tülays IKT-sida: Visualiserade kartor. Visual Storytelling i skolan Projektet syftar till att på ett mer systematiskt sätt tillgängliggöra den kraft som visual storytelling och interaktiva statistikvisualiseringar kan skapa för elever och deras lärare.
If it were my home Jämför Sverige med andra länder Länders area Här kan du se visualisering av den "sanna" storleken av olika länder. D-maps.com : free maps, free blank maps, free outline maps, free base maps. 40 maps that explain the world. By Max Fisher By Max Fisher August 12, 2013 Maps can be a remarkably powerful tool for understanding the world and how it works, but they show only what you ask them to.
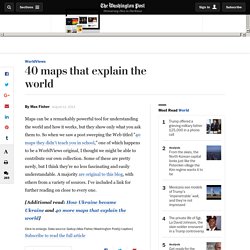
So when we saw a post sweeping the Web titled "40 maps they didn't teach you in school," one of which happens to be a WorldViews original, I thought we might be able to contribute our own collection. Some of these are pretty nerdy, but I think they're no less fascinating and easily understandable.
A majority are original to this blog, with others from a variety of sources. I've included a link for further reading on close to every one. [Additional read: How Ukraine became Ukraine and 40 more maps that explain the world] Click to enlarge. A Fun Map Quiz Game. This map of Earth is the most accurate ever produced, and it looks completely different. Japanese architect Hajime Narukawa claims to have tackled a centuries-old problem - how to draw an oblate spheroid Earth on a flat plane.
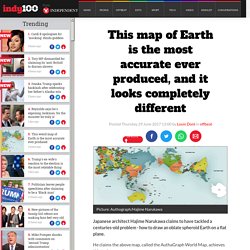
He claims the above map, called the AuthaGraph World Map, achieves this task. The projection, first created in 1999, frames the world's physical components in a 2D rectangle, attempting to represent their relative sizes as accurately as possible. It does so by dividing the world into 96 triangles, making it a tetrahedron, then unfolding it to become a rectangle. Unlike the traditional Mercator map, made in the 16th century, which overstates the size of northern areas like Greenland and minimizes that of central areas like Africa, the AuthaGraph World Map retains parity of area to a 3D projection.
The projection recently won the 2016 good design grand award in Japan, an awards evening founded in 1957 by the Japanese ministry of international trade and industry. Geografi kartor – Google Drive. D-maps.com : free maps, free blank maps, free outline maps, free base maps. Smart is the New Sexy - Timeline. Real-Time Lightning Map.