
Get Data Into Google Data Studio. Business intelligence. Simplified. Stitch: Simple, extensible ETL built for data teams. Integromat. Data Warehouse Automation Done Right. Know the progress of your data ingestions and query status Panoply’s main dashboard gives you full transparency into your data pipeline processes and performance optimizations to make it even easier to view the status of data source integrations, storage space, and query processing times.
How to Connect Google DataStudio to MySQL Database (cPanel Flavor) How to Connect Google DataStudio to MySQL Database (cPanel Flavor) Ok, so say you have a cPanel database (say you’ve got some of your company’s data in a self-hosted app you’ve made like the link building database we use in connection with our SEO Services and our DataStudio consulting services.
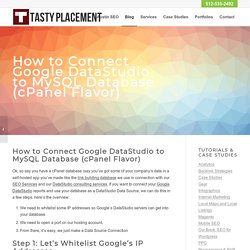
If you want to connect your Google DataStudio reports and use your database as a DataStudio Data Source, we can do this in a few steps, here’s the overview: We need to whitelist some IP addresses so Google’s DataStudio servers can get into your database.We need to open a port on our hosting account.From there, it’s easy, we just make a Data Source Connection Step 1: Let’s Whitelist Google’s IP Addresses. Professional Services. Cluvio. Google Developers. Data visualization. Change over time Change over time charts show data over a period of time, such as trends or comparisons across multiple categories.
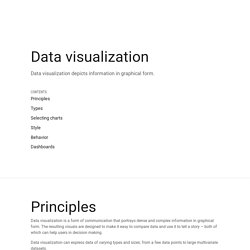
Common use cases include: Stock price performanceHealth statisticsChronologies Category comparison Category comparison charts compare data between multiple distinct categories. Use cases include: Income across different countriesPopular venue timesTeam allocations. See Google's first guidelines for data visualization. Data Stories for the SDGs Beautiful PHP Charts & Graphs. Top 7 Places to Find Data Online. A lot of times data could have been entered incorrectly, instead of $11,000.00 someone might have typed in $1,100.00 or $11,00.00.
Using the sorting options described above can help spot the most obvious examples of these. Using MySQL and PHP with Google Maps Overview This tutorial shows you how to display information from a MySQL database on a Google Map using the Maps JavaScript API.
It suits people with intermediate knowledge of MySQL, PHP and XML. The map in this tutorial displays two kinds of markers to differentiate between the location of restaurants and bars respectively. A database in MySQL stores information about the individual marker locations like the type of place (whether it's a restaurant or a bar), its name, address and geographic coordinates. The map retrieves this information from the database, through an XML file that acts as an intermediary between the database and the map. Click a marker on the map below to display an info window with the location name and address.
The sample below shows the entire code you need to create this map. Try it yourself. Online Chart Maker. Visual Site Mapper - www.smartypantspdx.com. Visual Site Mapper - www.smartypantspdx.com. Data Visualization as a Service — Reflect. Silhouettes of children protecting the environment Vector. Champion soccer club 199,206 184 2 years ago Landscape looking fun nature sunset 8 2 2 weeks ago.
Create Beautiful Presentations with Online Presentation Maker Haiku Deck - Visual Contenting. Whether you want to gain that first impression with your manager, nail your pitch and win over your potential clients or get maximum results on launching new products, presentations play a big role.
In this digital era where visual storytelling is the key to any marketing success, good presentations are one of essential ingredients that contribute to this success. Visual presentations stick in people’s mind for longer.Visual presentations stick in people’s mind for longer. Click To Tweet The most popular presentations have an average of 37 or more images.The most popular presentations have an average of 37 or more images. Click To Tweet Visuals increase retention by 42%.Visuals increase retention by 42%. Learning from Lombardi. Learning from Lombardi This was originally prepared in 2009 for a panel assembled by Alice Rawsthorn at Experimenta in Lisbon, Portugal.
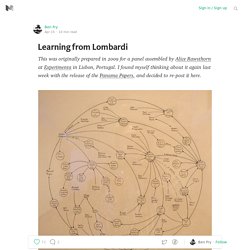
I found myself thinking about it again last week with the release of the Panama Papers, and decided to re-post it here. For Project Management. Space GIF. Sunrise & Sunset Times. Custom post types in WordPress. One of the things I’ve been hoping would be implemented in WordPress for years is the ability to create custom content types.
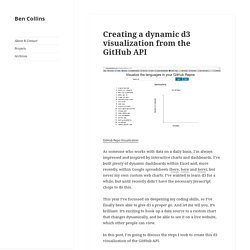
The inability to do this has been WordPress’ weakest point when compared to rivals in the CMS market. In WordPress 3.0, we’ll have the capability to easily create and manage content via custom post types. The WordPress Template Hierarchy - a visualization resource. Flowchart.js. Raw. Creating a dynamic d3 visualization from the GitHub API. As someone who works with data on a daily basis, I’m always impressed and inspired by interactive charts and dashboards.
Interactive Data Visualization for the Web. Copyright © 2013 Scott Murray Printed in the United States of America. O’Reilly books may be purchased for educational, business, or sales promotional use. Online editions are also available for most titles ( For more information, contact our corporate/institutional sales department: 800-998-9938 or <corporate@oreilly.com>. Nutshell Handbook, the Nutshell Handbook logo, the cover image, and the O’Reilly logo are registered trademarks of O’Reilly Media, Inc.
Interactive Data Visualization for the Web, the cover image of a long-tail bushtit, and related trade dress are trademarks of O’Reilly Media, Inc. These charts explain why BYOD security is critical. I was 31 when I was diagnosed with breast cancer. My gynecologist called, and I ducked into the supply closet of our Union Square office for some privacy. She said something about a New York Times article, about estrogen receptors. Cloud. How to Find the Right Chart Type for your Numeric Data. 22 Feb 2016. Highcharts Cloud. Chrome Experiments.
9 Design Techniques for User-Friendly Tables. By anthony on 07/11/11 at 12:33 pm Tables are great for comparing different information. But making them user-friendly is a challenge. One challenge is that table grids limit the amount of data you can display in a cell. Another is that when users read tables, they move their eyes across rows and down columns to scan information. If the table isn’t easy to scan, they can lose their point of reference and get lost. 3D Funnel chart demo. The top 20 data visualisation tools.
The 20 best tools for data visualization. It's often said that data is the new world currency, and the web is the exchange bureau through which it's traded. As consumers, we're positively swimming in data; it's everywhere from labels on food packaging design to World Health Organisation reports.
As a result, for the designer it's becoming increasingly difficult to present data in a way that stands out from the mass of competing data streams. Get Adobe Creative Cloud. Design. Periscope. Bookworm. Import.io blog. JavaScript Charts and Maps. Data Lab. Charted. Charted. Introducing Charted — Data Lab. NVD3. Timeline JS - Beautifully crafted timelines that are easy, and intuitive to use. Highcharts - Interactive JavaScript charts for your webpage. D3.js Presentation. Web Standards. D3 is built on top of several common web standards. Don’t worry if you don’t know all the nitty-gritty details of these standards, you can pick this stuff up pretty quickly. HTML (HyperText Markup Language) is a text format that most web pages are written in.
HTML uses a standard set of tags to define the different structural components of a webpage: <h1>, <h2>tags define headers, <p> tags define paragraphs, <ol> and <ul> are orderered and unordered lists. Browsers have common ways to display these tags, so lists show up like lists, and headers like headers. The <div> and <span> tags are special because browers don’t apply default styles to them, so HTML authors can use them to define custom groups.
Data Visualization with D3.js. Speaker Deck - Share Presentations without the Mess. XP Calculator and Leaderboard. One of the key components of gamification is feedback. HTML5 JavaScript dynamic client side data visualization.
Demos - JavaScript InfoVis Toolkit. JavaScript InfoVis Toolkit. Rappid - modular diagram builder. Koalas to the Max dot Com. Tributary. Raphaël—JavaScript Library. Earth wind map. Visualizing Urban Futures. This data visualization comes from the Anti-Eviction Mapping Project in San Francisco. The map visualizes the locations of evictions related to the use of a certain state law (the Ellis Act).