
A16Z AI Playbook. Machine Learning and Artificial Intelligence. Interpretable Machine Learning. Machine learning has great potential for improving products, processes and research. But computers usually do not explain their predictions which is a barrier to the adoption of machine learning. This book is about making machine learning models and their decisions interpretable. After exploring the concepts of interpretability, you will learn about simple, interpretable models such as decision trees, decision rules and linear regression. Later chapters focus on general model-agnostic methods for interpreting black box models like feature importance and accumulated local effects and explaining individual predictions with Shapley values and LIME.
All interpretation methods are explained in depth and discussed critically. The book focuses on machine learning models for tabular data (also called relational or structured data) and less on computer vision and natural language processing tasks. You can buy the PDF and e-book version (epub, mobi) on leanpub.com. Website: Follow me on Twitter! Road Map for Choosing Between Stat Modeling and ML. When we raise money it’s AI, when we hire it's machine learning, and when we do the work it's logistic regression.
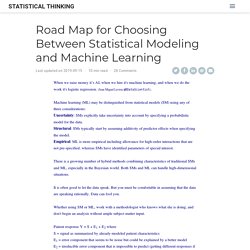
(Juan Miguel Lavista @BDataScientist). Machine learning (ML) may be distinguished from statistical models (SM) using any of three considerations:Uncertainty: SMs explicitly take uncertainty into account by specifying a probabilistic model for the data.Structural: SMs typically start by assuming additivity of predictor effects when specifying the model.Empirical: ML is more empirical including allowance for high-order interactions that are not pre-specified, whereas SMs have identified parameters of special interest. There is a growing number of hybrid methods combining characteristics of traditional SMs and ML, especially in the Bayesian world. Both SMs and ML can handle high-dimensional situations. It is often good to let the data speak. Note that the usual lasso is highly parametric. On Moving from Statistics to Machine Learning, the Final Stage of Grief.
I’ve spent the last few months preparing for and applying for data science jobs.
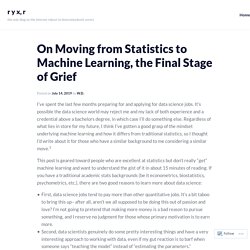
It’s possible the data science world may reject me and my lack of both experience and a credential above a bachelors degree, in which case I’ll do something else. Regardless of what lies in store for my future, I think I’ve gotten a good grasp of the mindset underlying machine learning and how it differs from traditional statistics, so I thought I’d write about it for those who have a similar background to me considering a similar move.1 This post is geared toward people who are excellent at statistics but don’t really “get” machine learning and want to understand the gist of it in about 15 minutes of reading.
If you have a traditional academic stats backgrounds (be it econometrics, biostatistics, psychometrics, etc.), there are two good reasons to learn more about data science: First, data science jobs tend to pay more than other quantitative jobs. Machine Learning Explained: supervised, unsupervised, and reinforcement learning. Machine learning is often split between three main types of learning: supervised learning, unsupervised learning, and reinforcement learning.
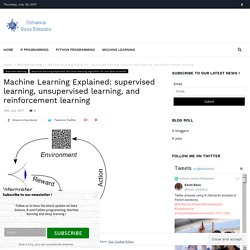
Knowing the differences between these three types of learning is necessary for any data scientist. The big picture The type of learning is defined by the problem you want to solve and is intrinsic to the goal of your analysis: You have a target, a value or a class to predict. For instance, let’s say you want to predict the revenue of a store from different inputs (day of the week, advertising, promotion). AI Literacy: The basics of machine learning. Top 15 Evaluation Metrics for Classification Models With Examples in R. Computing just the accuracy score for a classification model gives an incomplete picture of your model’s performance.
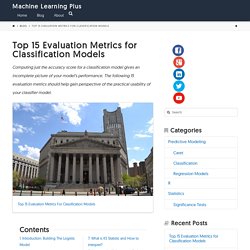
The following 15 evaluation metrics should help gain perspective of the practical usability of your classifier model. Contents 1. Introduction: Building The Logistic Model 2. The Confusion Matrix 3. 1. To show the use of evaluation metrics, I need a classification model. Machine Learning Modelling in R Cheat Sheet. Introducing correlationfunnel v0.1.0. Written by Matt Dancho on August 7, 2019 I’m pleased to announce the introduction of correlationfunnel version 0.1.0, which officially hit CRAN yesterday.
The correlationfunnel package is a tool that enables efficient exploration of data, understanding relationships, and get to business insights as fast as possible. I’ve taught correlationfunnel to my 500+ students enrolled in the Advanced Machine Learning course (DS4B 201-R) at Business Science University. The results have been great so far. Grid Search and Bayesian Hyperparameter Optimization using {tune} and {caret} packages. A priori there is no guarantee that tuning hyperparameter(HP) will improve the performance of a machine learning model at hand.
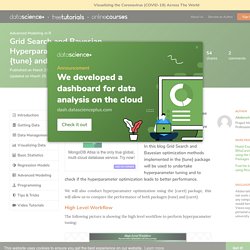
In this blog Grid Search and Bayesian optimization methods implemented in the {tune} package will be used to undertake hyperparameter tuning and to check if the hyperparameter optimization leads to better performance. We will also conduct hyperparamater optimization using the {caret} package, this will allow us to compare the performance of both packages {tune} and {caret}. High Level Workflow The following picture is showing the high level workflow to perform hyperparameter tuning: Hyperparameter Optimization Methods. Comparing ML tree-based algorithms for predicting clothing classes. By Florianne Verkroost Florianne Verkroost is a Ph.D. candidate at Nuffield College at the University of Oxford.
She has a passion for data science and a background in mathematics and econometrics. She applies her interdisciplinary knowledge to computationally address societal problems of inequality. Kaggle. The Matrix Calculus You Need For Deep Learning. Applying gradient descent - primer. Every so often a problem arises where it’s appropriate to use gradient descent, and it’s fun (and / or easier) to apply it manually.
Recently I’ve applied it optimising a basic recommender system to ‘unsuppressing’ suppressed tabular data. I thought I’d do a series of posts about how I’ve used gradient descent, but figured it was worth while starting with the basics as a primer / refresher. To understand how this works gradient descent is applied we’ll use the classic example, linear regression. K-means from Scratch with R. Kmeans is one of the most popular and simple algorithm to discover underlying structures in your data.
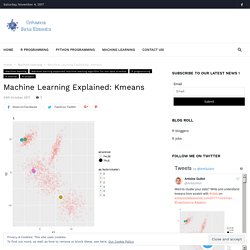
The goal of kmeans is simple, split your data in k different groups represented by their mean. The mean of each group is assumed to be a good summary of each observation of this cluster. Kmeans Algorithm We assume that we want to split the data into k groups, so we need to find and assign k centers. R sim of the expectation–maximization (EM) algorithm for k-means. Intuition for PCA. Principal component analysis (PCA) is a dimension-reduction method that can be used to reduce a large set of (often correlated) variables into a smaller set of (uncorrelated) variables, called principal components, which still contain most of the information.
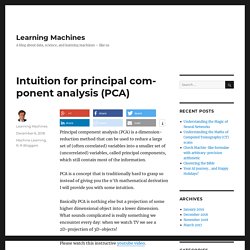
PCA is a concept that is traditionally hard to grasp so instead of giving you the n’th mathematical derivation I will provide you with some intuition. Basically PCA is nothing else but a projection of some higher dimensional object into a lower dimension. What sounds complicated is really something we encounter every day: when we watch TV we see a 2D-projection of 3D-objects! Please watch this instructive youtube video. Making sense of PCA, eigenvectors & eigenvalues. Linear Discriminant Analysis in R: An Intro. How does Linear Discriminant Analysis work and how do you use it in R? This post answers these questions and provides an introduction to Linear Discriminant Analysis.
Linear Discriminant Analysis (LDA) is a well-established machine learning technique for predicting categories. Its main advantages, compared to other classification algorithms such as neural networks and random forests, are that the model is interpretable and that prediction is easy. The intuition behind Linear Discriminant Analysis. Evaluating Options for Amazon's HQ2 Using Stack Overflow Data. Amazon is a technology behemoth, employing half a million people globally and hiring nearly 130,000 people in 2017. Amazon has been headquartered in Seattle since its early days in the 1990s, but in September 2017, the company announced a search for a secondary headquarters elsewhere in North America.
Over 200 cities entered bids to be considered, and last month, Amazon announced a list of 20 finalists. What goes into this kind of choice? Amazon says it wants a city with more than one million residents, access to an airport, and decent commutes. Here at Stack Overflow, we can offer a different view on the question. A Visual Intro to Machine Learning. Finding better boundaries Let's revisit the 73-m elevation boundary proposed previously to see how we can improve upon our intuition. Clearly, this requires a different perspective. By transforming our visualization into a histogram, we can better see how frequently homes appear at each elevation.
While the highest home in New York is 73m, the majority of them seem to have far lower elevations. A Visual Intro to Machine Learning Part 2. Neural networks and deep learning. A Neural Network Playground. Um, What Is a Neural Network? It’s a technique for building a computer program that learns from data. It is based very loosely on how we think the human brain works. First, a collection of software “neurons” are created and connected together, allowing them to send messages to each other. Next, the network is asked to solve a problem, which it attempts to do over and over, each time strengthening the connections that lead to success and diminishing those that lead to failure. Neural Networks: How they work, and how to train them in R. With the current focus on deep learning, neural networks are all the rage again.
(Neural networks have been described for more than 60 years, but it wasn't until the the power of modern computing systems became available that they have been successfully applied to tasks like image recognition.) How to choose the number of hidden layers and nodes in a feedforward neural network? Neural network architectures. The mostly complete chart of Neural Networks, explained. Deep Learning Cheatsheet. Would you like to see this cheatsheet in your native language? You can help us translating it on GitHub! R interface to Keras. R interface to Keras. Tfhub: R interface to TensorFlow Hub. 37 Reasons why your Neural Network is not working – Slav. Why Momentum Really Works. Data ex machina. Washing Machine (1961), Roy Lichtenstein Recently, Andrej Karpathy, head of AI at Tesla, wrote “Software 2.0.”, describing what he sees as a fundamental shift in the way software works.
Software 1.0 is “explicit instructions to the computer written by a programmer.” Instead of writing lines of code, he writes that, “Software 2.0 is written in neural network weights.” Basics behind GAN’s in R and Python. Generative Adversarial Networks are great for generating something from essentially nothing and there are some interesting uses for them. Most uses are some sort of image processing. Nvidia’s GauGAN is an impressive example, giving the user an MS paint-like interface and generating landscapes. You can give the beta a shot here. Getting started with deep learning in R. TensorFlow for R - RStudio. Lime v0.4: The kitten picture edition. The meat of this release centers around two new features that are somewhat linked: Native support for keras models and support for explaining image models. keras and images J.J.
RStudio GPU Workstations in the Cloud with Paperspace. We are very pleased to announce the availability of an RStudio TensorFlow template for the Paperspace cloud desktop service. If you don’t have local access to a modern NVIDIA GPU, your best bet is typically to run GPU intensive training jobs in the cloud. Large scale machine learning using TensorFlow, BigQuery and CloudML Engine within RStudio. The Case for tidymodels. By Joseph Rickert.
Usemodels 0.0.1. We’re very excited to announce the first release of the usemodels package. The tidymodels packages are designed to provide modeling functions that are highly flexible and modular. TidyTuesday and tidymodels. TidyTuesday hotel bookings and recipes. Hyperparameter tuning and #TidyTuesday food consumption. Preprocessing and resampling using #TidyTuesday college data. LASSO regression using tidymodels and #TidyTuesday data for The Office. Tuning random forest hyperparameters with #TidyTuesday trees data. Bootstrap resampling with #TidyTuesday beer production data. Multinomial classification with tidymodels and #TidyTuesday volcano eruptions. Tune XGBoost with tidymodels and #TidyTuesday beach volleyball. Impute missing data for #TidyTuesday voyages of captive Africans with tidymodels.
Train and analyze many models for #TidyTuesday crop yields. Uncanny X-Men: Bayesian take on Dr. Silge’s analysis. Tune random forests for #TidyTuesday IKEA prices. Predicting injuries for Chicago traffic crashes. Bootstrap CIs for #TidyTuesday Super Bowl commercials. Machine learning with tidymodels. Tidymodels: tidy machine learning in R. Facets: An Open Source Visualization Tool for Machine Learning Training Data. Teachable Machine. Google AI Blog: The What-If Tool: Code-Free Probing of Machine Learning Models. Bot or Not: A Twitter user classifier. Talk to Books. Google Cloud AI Explanations to increase fairness, responsibility, and trust. Machine Learning A-Z™: Hands-On Python & R In Data Science. Supervised ML case studies in R! Free interactive course. In-depth intro to machine learning in 15 hours of expert videos. Machine Learning Flashcards.
Ethics Framework - Responsible AI. ML/AI research for Patient Benefit: 20 Critical Questions on Transparency, Replicability, Ethics and Effectiveness. The Myth of the Impartial Machine.