
Jeremy Clarkson. Map of the City Where Every Novel Takes Place. A few days ago we posted this imaginary map of a city where every movie takes place, and luckily there is a literary version too!
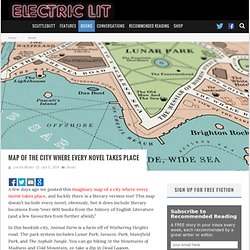
This map doesn’t include every novel, obviously, but it does include literary locations from “over 600 books from the history of English Literature (and a few favourites from further afield).” In this bookish city, Animal Farm is a farm off of Wuthering Heights road. The park system includes Lunar Park, Jurassic Park, Mansfield Park, and The Asphalt Jungle. You can go hiking At the Mountains of Madness and Cold Mountain, or take a dip in Dead Lagoon. Designed by Dorothy, you can purchase the map as a 60cm x 80cm print. For things best explained with charts. Size Comparison - Science Fiction spaceships by DirkLoechel on deviantART. 50-years-exploration-huge.jpg (JPEG Image, 3861×1706 pixels) Doctor Who companions poster, 50 years! Star-Wars-World-Influence-Infographic-1.png (PNG Image, 1853×1118 pixels) The Internet of Things Infographic. The Internet of Things Infographic The time was when the internet was people on their PCs sending email and surfing web content dished up by servers.

Sure, it was around before that in its academic/military guise, but as far as the public consciousness was concerned, PCs, laptops, email and the web, was all the internet meant. A few years ago that changed, imperceptibly at first, such that now the recurrent understanding of the internet is far more diverse, feral even. Myriad devices and people creating content in multiple forms, for consumption on an increasing array of devices. And it’s changing industry too- internet-connected combine harvesters, anyone?
The proliferation is still happening, and this press kit, based around an infographic that attempts to illustrate this phenomenon, explores various aspects of “The Internet of Things.” Untitled. Modern Science Map The Periodic Table of Irrational Nonsense Mr.
Credulous The Ladybird Bookof Chiropractic Treatment and English Libel Law If Homeopathy Works ... God Was Never On Your Side Skeptic Park feat. Skeptic Park 2 feat. Skeptic Park 3 feat. Guess Who? Trolling for Dummies by David Mabus A Handy Alternative Medicine Flowchart Rupert and the God Delusion The Periodic Table of Urban Biscuit Myths Why I Love Carl Sagan Why Malcolm Tucker should be the next Doctor Who More reasons why Malcolm Tucker should be the next Doctor Who Skeptic Trumps The Papal Facebook Page Celebrity Quack Trumps (Part 1) Celebrity Quack Trumps (Part 2) Karma Kanics The Woo Woo Wheel The Crudity of Early Home Computing Trinity to split over spiritual differences The Turin Bicycle Cardinal Tucker: Papal Advisor Compare The Ideology.
PopChartLab_Superpowers_FinalFinal-Large.jpg (JPEG Image, 1308×1734 pixels) Timeline of Major Events & Trends on Datavisualization. Peter von Stackelberg designed this complex timeline of social, technological, economic and political events and trends from 1750 to 2100.
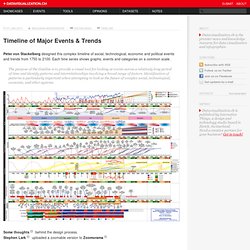
Each time series shows graphs, events and categories on a common scale. The purpose of the timeline is to provide a visual tool for looking at events across a relatively long period of time and identify patterns and interrelationships involving a broad range of factors. Identification of patterns is particularly important when attempting to look at the future of complex social, technological, economic, and other systems. Some thoughts behind the design process.Stephen Lark uploaded a zoomable version to Zoomorama. Radiohead-big.jpg (JPEG Image, 828×1024 pixels) - Scaled (85. Because Every Country Is The Best At Something. Wardshelley_scifiSmaller.jpg (JPEG Image, 3400×1826 pixels) - Scaled (47%)
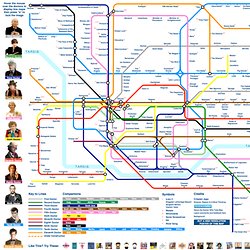
Transparency.jpg (JPEG Image, 2000x1200 pixels) Geek-evolution.png (PNG Image, 1000x2448 pixels) Vizualize.me: Visualize your resume in one click. The Ultimate Nerd Guide To New York City. Spaceship.jpg (JPEG Image, 2000x2000 pixels) Mapping Stereotypes by alphadesigner. Get your copy on: Amazon US / Amazon UK / Amazon DE / Amazon FR / Amazon IT / Amazon ES / Amazon Canada / Amazon Japan / Amazon India / Amazon Brazil Atlas of Prejudice: The Complete Stereotype Map Collection.

Rock'n'roll metro map.