
Bandwidth Monitoring Tools For Linux. Bandwidth in computer networking refers to the data rate supported by a network connection or interface.
One most commonly expresses bandwidth in terms of bits per second (bps). The term comes from the field of electrical engineering, where bandwidth represents the total distance or range between the highest and lowest signals on the communication channel (band). Bandwidth represents the capacity of the connection. The greater the capacity, the more likely that greater performance will follow, though overall performance also depends on other factors, such as latency. Bandwidthd BandwidthD tracks usage of TCP/IP network subnets and builds html files with graphs to display utilization. Project Home Page Bmon bmon is a portable bandwidth monitor and rate estimator running on various operating systems. Bwbar.
LVM - Physical Volume Management on CentOS 6 - GeekPeek.Net. LVM quickly explained: As seen in the LVM design scheme, Physical Volumes (PV) are the bottom layer of LVM.
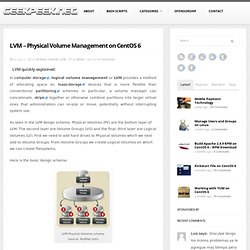
The second layer are Volume Groups (VG) and the final, third layer are Logical Volumes (LV). First we need to add hard drives to Physical Volumes which we next add to Volume Groups. From Volume Groups we create Logical Volumes on which we can create filesystems. Here is the basic design scheme: LVM Physical Volumes scheme (source: RedHat.com) Physical Volume Management is a part 1/3 of LVM Management on CentOS! In this post we will learn how to create, delete and move Physical Volumes (PV). For this example we have 3 additional hard drives: /dev/sdb (1GB), /dev/sdc (2GB) and /dev/sdd (3GB). 1. We can display all Physical Volumes (PV’s) on the system with the “pvdisplay” command: We can also display Physical Volumes with “pvscan” or “pvs” commands, but as we see the output is a bit different – use the one you like the most:
SendmailAnalyzer: Features. Traffic Shaping. Traffic Accounting with Linux IPTables. A few years ago I worked as a Linux system administrator at a small (few hundred users) Internet service provider.
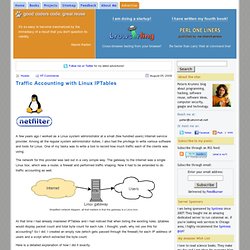
Among all the regular system administrator duties, I also had the privilege to write various software and tools for Linux. One of my tasks was to write a tool to record how much traffic each of the clients was using. The network for this provider was laid out in a very simple way. The gateway to the Internet was a single Linux box, which was a router, a firewall and performed traffic shaping. Now it had to be extended to do traffic accounting as well. Simplified network diagram, all that matters is that the gateway is a Linux box. At that time I had already mastered IPTables and I had noticed that when listing the existing rules, iptables would display packet count and total byte count for each rule.
Auditing File Access With Samba and Splunk - My Wushu Blog. Preamble The other week, we had an issue with our working production data on our ZFS file servers.
We have a running service that uses a CIFS share to extract file contents, read in a XML file, and then from that file, build out a directory structure based on a field in that order file. I won’t get into the horrible details, but we eventually discovered that this service does not halt or error an order if that field is missing! What it decided to do instead, was operate at the top level of the CIFS share and “clean up” the directory. There were a few hard lessons learned here. After the dust settled and we re-created the working data there were two questions: Where is the dataDo we have a log of who deletes what? Before this mis-adventure, the only way I was aware of tracking smbd was with additional logging. Fortunately, in the wee hours of the night (this issue lasted until 2am), I ran across how I could enable the full_audit vfs module in Samba. Samba Configuration Syslog Final Thoughts.
Monitoring Hard Drive Health on Linux with smartmontools. S.M.A.R.T. is a system in modern hard drives designed to report conditions that may indicate impending failure. smartmontools is a free software package that can monitor S.M.A.R.T. attributes and run hard drive self-tests.

Although smartmontools runs on a number of platforms, I will only cover installing and configuring it on Linux. Why Use S.M.A.R.T.? Basically, S.M.A.R.T. may give you enough of a warning that you can safely backup all your data before your hard drive dies. There is some amount of conflicting information on the internet about how reliable the warnings are. The best source of research that I found is a paper from Google that describes an internal study of hard drive failure. A good source for more information is the S.M.A.R.T. wikipedia page.
Installation On Debian or Ubuntu systems: $ sudo apt-get install smartmontools On Fedora: $ sudo yum install smartmontools Capabilities and Initial Tests $ sudo smartctl -i /dev/sda $ sudo smartctl -d TYPE -i /dev/sda.