
X3DOM - home. SIMILE Widgets. Gallery. Gka/chroma.js. Visualize.js. Piccolo2D - A Structured 2D Graphics Framework. Cesium - WebGL Virtual Globe and Map Engine. Vega. Vis.js - A dynamic, browser based visualization library. Protovis. Protovis composes custom views of data with simple marks such as bars and dots.
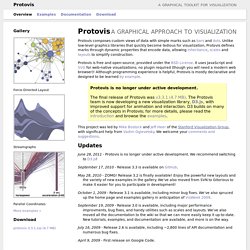
Unlike low-level graphics libraries that quickly become tedious for visualization, Protovis defines marks through dynamic properties that encode data, allowing inheritance, scales and layouts to simplify construction. Protovis is free and open-source, provided under the BSD License. It uses JavaScript and SVG for web-native visualizations; no plugin required (though you will need a modern web browser)! Although programming experience is helpful, Protovis is mostly declarative and designed to be learned by example. Protovis is no longer under active development.The final release of Protovis was v3.3.1 (4.7 MB). This project was led by Mike Bostock and Jeff Heer of the Stanford Visualization Group, with significant help from Vadim Ogievetsky.
Updates. Processing.org. Accounts Receivable I - Visual BI. BIRT Home. OSCONPortland, ORJuly 20-24 View Full Calendars: BIRT Developer Center Community Calendar | Eclipse Calendar How to Add Custom Visualizations in BIRT iHub 3.1 OpenText recently released BIRT iHub 3.1, the latest version of iHub.
The release adds several features, including a REST API and support for Custom Visualizations. In this post, I will explain what custom visualizations are and show you how you can include third-party visualizations in BIRT content with essentially no coding. Custom Visualization Basics Data visualization...Read More See More Blogs: BIRT Developer Center Community Blogs | BIRT World | Planet Eclipse Blog. Virtuoso Open-Source Edition. What's New 2014-02-17: New VOS 7.1.0 Released Virtuoso 7.1.0 includes improvements in the Engine (SQL Relational Tables and RDF Property/Predicate Graphs); Geo-Spatial support; SPARQL compiler; Jena and Sesame provider performance; JDBC Driver; Conductor CA root certificate management; WebDAV; and the Faceted Browser.
Visual Data Discovery Solutions. Download and start your trial, it’s free for 14 days with no obligation and no credit card required.
Datawatch Desktop consists of two modules. Our modular design ensures you gain maximum value from all your data including real-time sources. Choose both of the modules, install, and experience the power of next generation analytics. Datawatch Desktop DesignerDesigner is the visual data discovery module enabling you to quickly and easily build solutions without the help of IT. Home · FlowingMedia/TimeFlow Wiki. OpenHeatMap. Welcome to the QGIS project! JavaScript InfoVis Toolkit. 20 Fresh JavaScript Data Visualization Libraries. There are plenty of JavaScript libraries out there for rendering your otherwise plain and boring numerical data into beautiful, interactive, and informative visualizations.

The beauty of using JavaScript for data visualization is that, if created correctly, your data will be highly accessible (usually via HTML tables). A long time ago (2008), I wrote about JavaScript solutions for graphing and charting data and this article revisits the topic with twenty more JavaScript libraries that you can use to bring your data to life. 1. Highcharts Highcharts is one of the most promising JavaScript charting libraries to hit the scene recently, with its large array of features including seven charting types (line, pie, and bar among them), the ability to zoom in and out of charts, and tooltips for offering more information about data points.
SIMILE Widgets. Datavisualization.ch Selected Tools. Draw Freely. Downloads. Download Tableau Public. Features. Gephi is a tool for data analysts and scientists keen to explore and understand graphs. Like Photoshop™ but for graph data, the user interacts with the representation, manipulate the structures, shapes and colors to reveal hidden patterns.
The goal is to help data analysts to make hypothesis, intuitively discover patterns, isolate structure singularities or faults during data sourcing. It is a complementary tool to traditional statistics, as visual thinking with interactive interfaces is now recognized to facilitate reasoning. This is a software for Exploratory Data Analysis, a paradigm appeared in the Visual Analytics field of research. Real-time visualization Profit from the fastest graph visualization engine to speed-up understanding and pattern discovery in large graphs. Layout Layout algorithms give the shape to the graph. Metrics. Download Free Windows Visualization Open Source Software - SourceForge. Data Visualizations.
All Datawatch platforms offer a wide range of interactive data visualizations optimized for fast visual data discovery and analysis.
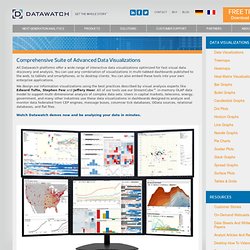
You can use any combination of visualizations in multi-tabbed dashboards published to the web, to tablets and smartphones, or to desktop clients. You can also embed these tools into your own enterprise applications. We design our information visualizations using the best practices described by visual analysis experts like Edward Tufte, Stephen Few and Jeffery Heer. All of our tools use our StreamCube™ in-memory OLAP data model to support multi-dimensional analysis of complex data sets.
Users in capital markets, telecoms, energy, government, and many other industries use these data visualizations in dashboards designed to analyze and monitor data federated from CEP engines, message buses, columnar tick databases, OData sources, relational databases, and flat files.Watch Datawatch demos now and be analyzing your data in minutes. Dashboard Software & Solutions.
Tulip. Tulip - Browse Files. Visualization and Data Mining Software. Mbostock (Mike Bostock)