
Couleurs. Photos. 20 Great Examples of PowerPoint Presentation Design. We can all agree that, in most cases, there's more than one way of doing something.
For example, some people default to the "loop, swoop, and pull" method when they tie their shoes, while others swear by the "bunny ears" technique. Either way you swing it, your shoes get tied, right? Trouble is, in some areas of life, different approaches don't always return the same results. When it comes to presentation design, for instance, there's no shortage of avenues you can take. And while all that choice -- colors, formats, visuals, fonts -- can feel liberating, it's important that you're careful in your selection as not all design combinations add up to success.
Download the full collection of PowerPoint presentation design examples here. We're not saying there's one right way to design your next PowerPoint presentation, but we are saying that some designs make more sense than others. 1) "The Search for Meaning in B2B Marketing," Velocity Partners 2) "You Don't Suck at PowerPoint," Jesse Desjardins. Presentation tool based on the power of CSS3 transforms and transitions in modern browsers. Recite.com - Create beautiful visual quotes as images. 10 Tools for Creating Infographics and Visualizations. The author's posts are entirely his or her own (excluding the unlikely event of hypnosis) and may not always reflect the views of Moz.
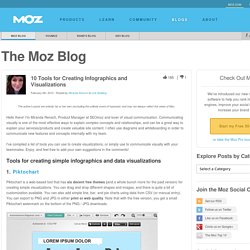
Hello there! I'm Miranda Rensch, Product Manager at SEOmoz and lover of visual communication. Communicating visually is one of the most effective ways to explain complex concepts and relationships, and can be a great way to explain your services/products and create valuable site content. I often use diagrams and whiteboarding in order to communicate new features and concepts internally with my team. I've compiled a list of tools you can use to create visualizations, or simply use to communicate visually with your teammates.
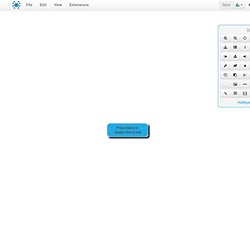
Tools for creating simple infographics and data visualizations 1. Piktochart is a web-based tool that has six decent free themes (and a whole bunch more for the paid version) for creating simple visualizations. 2. Easel.ly is another free web-based tool for creating infographics. Press Space or double-click to edit. This operation requires a valid MindMup Gold License.
Export, save and embed larger maps using MindMup Gold. We have sent a temporary access code to your e-mail. Please wait, your license is being restored We could not find that email or username. If you are a new user select I want to sign up, or go Back to provide a different email. Please wait, sending the access code to your e-mail The code you entered was rejected. If you think this is an error, please email us at contact@mindmup.com This operation is not authorised under your current MindMup Gold License. Click on Log Out to change the active license in this browser or Renew to extend the current subscription. If you think that this is an error, please send us an e-mail at contact@mindmup.com This license is invalid or expired Click on Log Out to change the active license in this browser. This license server is unavailable at the moment. A subscription has not been purchased for this license. This license has expired.
Sites/default/files/resources/SJLTransformativeOrganizing.pdf. Go premium. Inspire Your Readers By Leading The Way.