
Wikipedia. Blogs. Photos. Internet Scavenger Hunts. To make it easier for teachers to search our archive of Internet Scavenger Hunts, we have reorganized them by month.

Click a month below for Internet Scavenger Hunts that are appropriate for that month. Click the "Anytime Scavenger Hunts" link to search out Internet Scavenger Hunts that might be used at any time during the year. (Note: We are aware that some of these scavenger hunts include inactive links. We are repairing those links as we find replacements, but we advise you to check each hunt's links before using the activity with your students.) Internet Scavenger Hunts for... Inauguration DayMakar SankrantiSnowflakes and Snow CrystalsAn Expedition to the North PoleThe Four SeasonsPenguins Around the WorldHappy Chinese New Year! Michael JordanBird Feeding MonthPancake WeekWhat's a Primary Election? Spring AheadA Visit to IrelandThe Four SeasonsWomen Who Left Their "Stamp" on HistoryThe Sounds of MusicMarch MadnessTour Yellowstone National ParkYou Are What You Eat.
Mercator Projection. By Matt T.
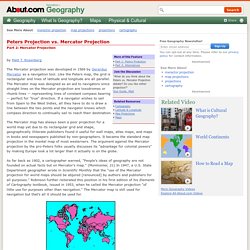
Rosenberg The Mercator projection was developed in 1569 by Gerardus Mercator as a navigation tool. Like the Peters map, the grid is rectangular and lines of latitude and longitude are all parallel. The Mercator map was designed as an aid to navigators since straight lines on the Mercator projection are loxodromes or rhumb lines -- representing lines of constant compass bearing -- perfect for "true" direction.
If a navigator wishes to sail from Spain to the West Indies, all they have to do is draw a line between the two points and the navigator knows which compass direction to continually sail to reach their destination. The Mercator map has always been a poor projection for a world map yet due to its rectangular grid and shape, geographically illiterate publishers found it useful for wall maps, atlas maps, and maps in books and newspapers published by non-geographers. Oblique Mercator. An oblique cylindrical projection that is conformal but not equal area.
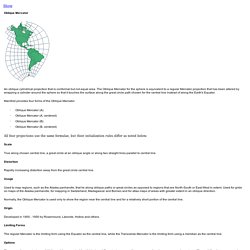
The Oblique Mercator for the sphere is equivalent to a regular Mercator projection that has been altered by wrapping a cylinder around the sphere so that it touches the surface along the great circle path chosen for the central line instead of along the Earth's Equator. Manifold provides four forms of the Oblique Mercator: · Oblique Mercator (A) · Oblique Mercator (A, centered) · Oblique Mercator (B) · Oblique Mercator (B, centered) All four projections use the same formulae, but their initialization rules differ as noted below.
Scale True along chosen central line, a great circle at an oblique angle or along two straight lines parallel to central line. Distortion Rapidly increasing distortion away from the great circle central line. Usage Used to map regions, such as the Alaska panhandle, that lie along oblique paths or great circles as opposed to regions that are North-South or East-West in extent. Origin Limiting Forms. Uses and Misuses of the Mercator Projection. The World Bank is not the only organization to misemploy the Mercator projection for basic world maps.
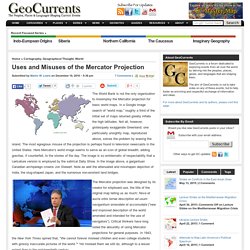
In a Google image search of “world map,” roughly a third of the initial set of maps returned greatly inflate the high latitudes. Not all, however, grotesquely exaggerate Greenland; one particularly unsightly map, reproduced above, solves the problem by erasing the island. The most egregious misuse of the projection is perhaps found in television newscasts in the United States. Here Mercator’s world image seems to serve as an icon of global breadth, adding gravitas, if counterfeit, to the stories of the day. Map Projections, Geography Glossary. Advertisement.
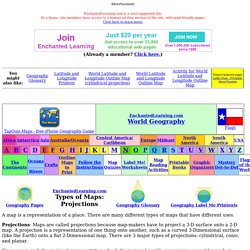
EnchantedLearning.com is a user-supported site. As a bonus, site members have access to a banner-ad-free version of the site, with print-friendly pages.Click here to learn more. (Already a member? Click here.) Map Projections. Map Projections It is impossible to accurately represent the spherical surface of the earth on a flat piece of paper.
While a globe can represent the planet accurately, a globe large enough to display most features of the earth at a usable scale would be too large to be useful, so we use maps. Also imagine peeling an orange and pressing the orange peel flat on a table - the peel would crack and break as it was flattened because it can't easily transform from a sphere to a plane. Robinson Map Library - Robinson Projection. Robinson called this the orthophanic projection (which means "right appearing"), but this name never caught on.
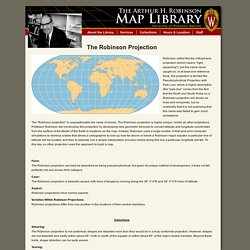
In at least one reference book, this projection is termed the Pseudocylindrical Projection with Pole Line, which is highly descriptive (the "pole line" comes from the fact that the North and South Poles on a Robinson projection are shown as lines and not points), but so unwieldily that it is not surprising that this name also failed to gain much acceptance. The "Robinson projection" is unquestionably the name of choice. The Robinson projection is highly unique. Unlike all other projections, Professor Robinson did not develop this projection by developing new geometric formulas to convert latitude and longitude coordinates from the surface of the Model of the Earth to locations on the map. Form: The Robinson projection can best be described as being pseudocylindrical, but given its unique method of development, it does not fall perfectly into any known form category.
Distortions. 1rst. Map Projections: Map Properties: Distortion Patterns. <br /><table class="warning" summary=""><tr><td><h2 class="warning">JavaScript Is Not Available</h2><table summary=""><tr><td><img src="../../..
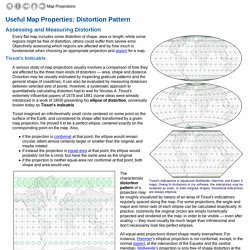
/StockImg/warning36.png" alt=""></td><td> </td><td><em>Since JavaScript is disabled or not supported in your browser, some or all maps in this page will not be displayed. </em></td></tr></table></td></tr></table><br /> Assessing and Measuring Distortion Every flat map includes some distortion of shape, area or length; while some regions might be free of distortion, others could suffer from severe error. Objectively assessing which regions are affected and by how much is fundamental when choosing an appropriate projection and aspect for a map.
Tissot's Indicatrix A serious study of map projections usually involves a comparison of how they are affected by the three main kinds of distortion — area, shape and distance. All equal-area projections distort shape nearly everywhere. Scaling and Angular Deformations Some Practical Examples. Google Maps Projection. When features on the curved surface of the Earth are represented on a flat surface, their shape or size will always be subject to distortion in one way or another.
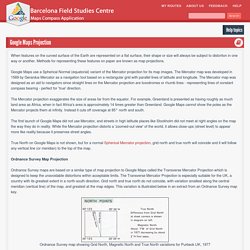
Methods for representing these features on paper are known as map projections. Why does Google use the Mercator projection on their maps, as opposed to an equal-area proportion map?