
SPSS Skills Checklist. Sociology 110B: SPSS Skills Checklist This page is part of the materials supporting the course Sociology 110B: Basic Statistics for Social Scientists.
The course is offered in the Department of Sociology at the University of California, Riverside, by Professor Robert A. Hanneman. This page provides links to the materials supporting the offering of Sociology 110B in the winter quarter of the 2004-05 academic year. Online Training Section - DSS at Princeton Univeristy. The New Science of Old Whiskey - Wayne Curtis. Bourbon makers attempt to perfect a 2,000-year-old invention.
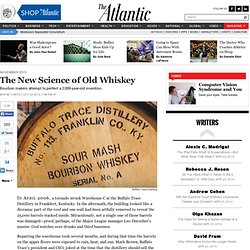
Buffalo Trace Distillery In April 2006, a tornado struck Warehouse C at the Buffalo Trace Distillery in Frankfort, Kentucky. In the aftermath, the building looked like a diorama: part of the roof and one wall had been artfully removed to reveal the 25,000 barrels stacked inside. Miraculously, not a single one of those barrels was damaged—proof, perhaps, of the Major League manager Leo Durocher’s maxim: God watches over drunks and third basemen. Pufferfish Make Seafloor Circles to Attract Mates. Peters Map. Video Games ProCon.org. Untitled.
Americans Are Way Behind in Math, Vocabulary, and Technology - Roberto A. Ferdman. The US boasts the world’s largest GDP and the planet’s most influential government, but its citizens aren’t all that intellectually exceptional.
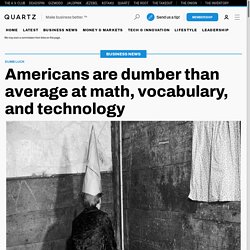
Americans have trouble with words… The report defines literacy as the “ability to understand, evaluate, use and engage with written texts to participate in society, to achieve one’s goals, and to develop one’s knowledge and potential” (p. 63). Only 78.3% of American adults reached a Level 2 (out of 5) in literacy, less than all other OECD members save Spain and Italy (p. 69). The average level of literacy in the US is on par with that of Cyprus, Poland and Austria (p. 65). …and numbers… When it comes to math, American adults aren’t any better. Numerical proficiency in the US—defined as the “ability to access, use, interpret and communicate mathematical information and ideas in order to engage in and manage the mathematical demands of a range of situations in adult life” (p. 77)—ranks near the bottom of all participating countries.
Statisticians Show How Much People Depend On Weather Reports. July 30, 2016 — An international team has devised a method for achieving 1 terapascal of static pressure - vastly higher than any previously ... read more July 29, 2016 — Scientists have tailored extremely small wires that carry light and electrons.
These new structures could open up a potential path to smaller, lighter, or more efficient devices, they ... read more July 29, 2016 — Climate and energy scientists have developed a new method to pinpoint which electrical service areas will be most vulnerable as populations grow and temperatures ... read more Replication Project Investigates Self-Control as Limited Resource July 29, 2016 — A new research replication project, involving 24 labs and over 2,100 participants, failed to reproduce findings from a previous study that suggested that self-control is a depletable ... read more Scientists Identify Immunological Profiles of People Who Make Powerful HIV Antibodies Vaccination: Zika Infection Is Caused by One Virus Serotype.
One-Way ANOVA Ch7. Effective analysis of reaction time data - viewcontent.cgi. Reaction Time Outliers - Handling. Attention Span Statistics. Grading on the Curve Is Always a Bad Idea. Via Teresa Nielsen Hayden, a smart overview and response to an upcoming recent Vanity Fair article about Microsoft’s “lost decade”.
The main culprit, according to the article, was apparently the rigid use of “stack ranking” in assessing the work of teams and groups, requiring a manager to rank the work of individuals within a group according to fixed percentages: a small number “excellent”, a large number “adequate”, a small number “poor” (with the bottom-ranking members usually terminated). It looks as if the article (and some of the excellent supporting links that Nielsen Hayden assembles) will document that this especially rigid use of stack ranking drove off some of Microsoft’s best employees, and that managers dreaded it as much as the people they were evaluating.
Why Grading on the Curve Hurts. Resources >> Browse Articles >> Assessment, Grading & Evaluations Featured Author: Kit Richert, Ph.D.

Kit joined Teaching after working as a middle school psychologist in the San Ramon Valley Unified School District in California. As a school psychologist, Kit worked extensively with Special Education students, and developed expertise in assessment, counseling, and behavior management. Kit was a clinical psychology major at Tufts University and received her Ph.D. in Education from UC Berkeley. Remember the game of musical chairs? The game is set up so that for one person to win, another must lose. Grading on the “Curve” is a method of grading that is based on the belief that letter grades in any given class should be distributed along a bell curve. Traditionally grading on the curve has been viewed as motivational by teachers because it fosters competition.
Psychology Professor Dr. In his book, Making the Grade, A Self-Worth Perspective on Motivation and School Reform Covington writes: